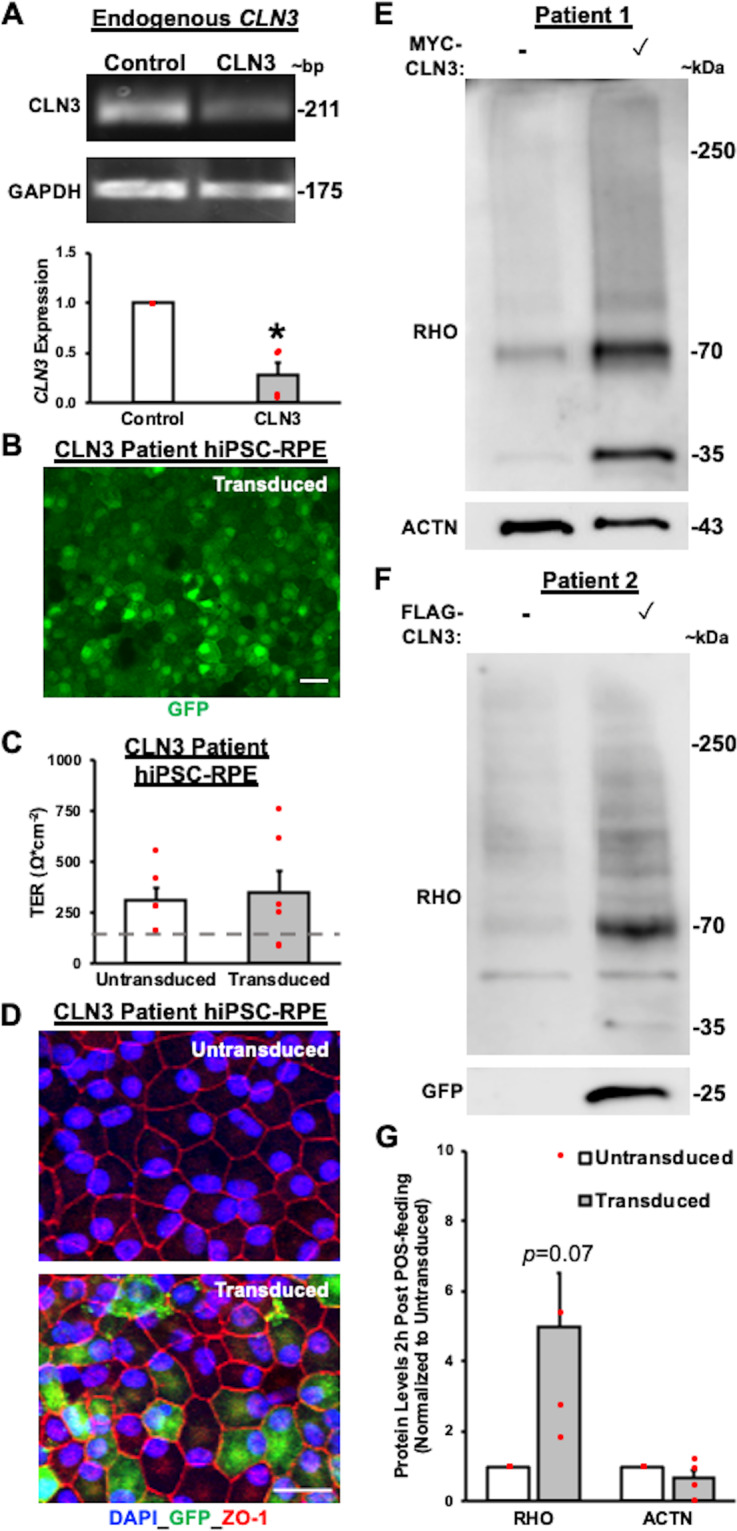
Fig. 8. Lentiviral-mediated overexpression of wild-type (WT)-CLN3 increases the amount of POS phagocytosed by CLN3 disease hiPSC-RPE cells.

A Qualitative gel electrophoreses images (top panel) and quantitative real-time PCR analyses (bottom panel) showing reduced expression of endogenous CLN3 gene in control versus CLN3 disease hiPSC-RPE cells (Control: n = 3, CLN3: n = 4; p = 0.0051) normalized to control hiPSC-RPE expression. GAPDH served as loading control. B Representative confocal microscopy images post immunostaining with GFP specific antibody showing robust expression of GFP in transduced CLN3 disease hiPSC-RPE cells (pHIV-FLAG-CLN3-IRES-EGFP). Scale bar = 20 µm. C Transepithelial resistance (TER) measurements showing no adverse effect of transduction on epithelial integrity in CLN3 hiPSC-RPE cells transduced with either pHIV-MYC-CLN3-IRES-EGFP or pHIV-FLAG-CLN3-IRES-EGFP lentiviral vectors (Control: n = 4, CLN3: n = 6; p = 0.79) in both control and CLN3 disease hiPSC-RPE cells grown as a monolayer on Transwell inserts. (Dotted line, TER reported in vivo threshold of ~150 Ω cm−2 42,43). D Representative confocal microscopy images showing similar localization of tight junction protein, ZO-1, in transduced CLN3 disease hiPSC-RPE cells and untransduced CLN3 disease hiPSC-RPE cells. Of note, robust expression of GFP can be seen in CLN3 disease hiPSC-RPE transduced cells (pHIV-FLAG-CLN3-IRES-EGFP). Of note, GFP localization in the nucleus is due to the nuclear and kinetic entrapment of EGFP homomultimers53. Scale bar = 20 µm, (n ≥ 3). E–G Representative Western blot images (E, F) post 2 h POS feeding (monomer band 35 kDa, dimer band 70 kDa, and aggregate/multimer bands between 35–70 kDa and >70 kDa) and quantitative analyses (G) showing increased amount of RHO relative to total protein (p = 0.07), but similar levels of ACTN relative to total protein (p = 0.24) in CLN3 disease hiPSC-RPE cells expressing WT-CLN3 (cells transduced with either pHIV-MYC-CLN3-IRES-EGFP or pHIV-FLAG-CLN3-IRES-EGFP lentiviral vectors) compared to untransduced CLN3 disease hiPSC-RPE cells (n = 4). Of note, as expected GFP band was observed only in transduced CLN3 disease hiPSC-RPE cells at ~27 kDa due to usage of bi-cistronic lentiviral pHIV-MYC-CLN3-IRES-EGFP and pHIV-FLAG-CLN3-IRES-EGFP vectors (F). Two-tailed unpaired Student’s t-test performed for all statistical analysis. *p < 0.05, **p < 0.005.
