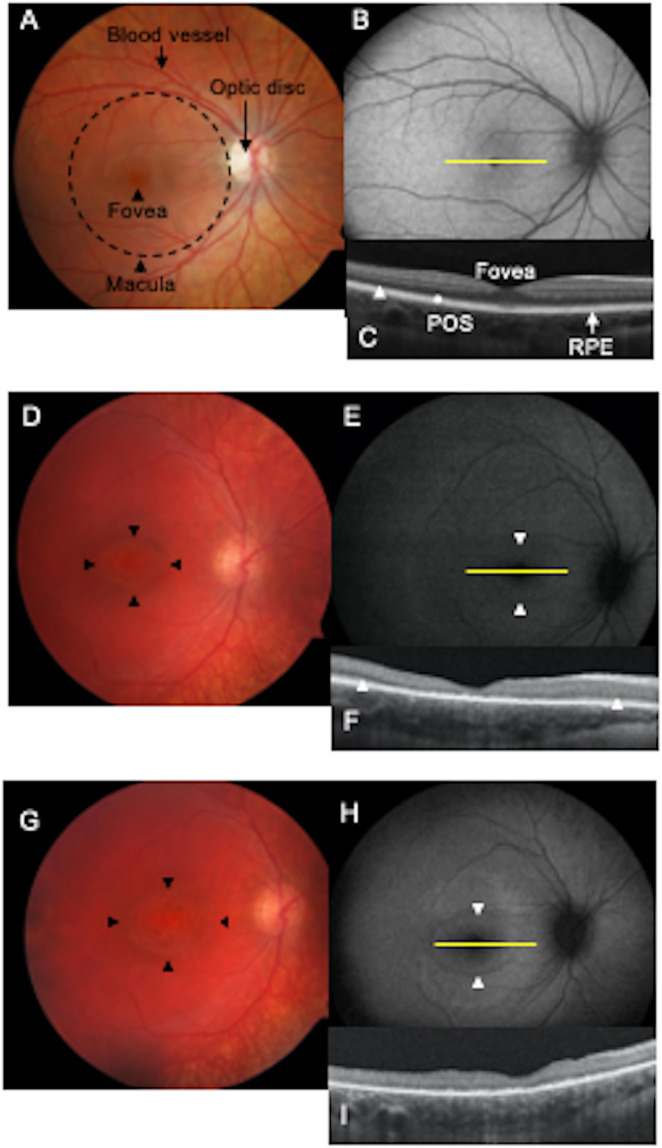
Fig. 9. Longitudinal multimodal imaging of a CLN3 disease patient is consistent with autofluorescent changes in photoreceptor–RPE complex preceding photoreceptor cell loss.
A–C Multimodal imaging of a normal eye. A Fundus photograph of a normal right eye. Dashed circle outlines roughly the macula. The fovea is marked with an arrowhead in the center of the macula. Blood vessel and optic disc are also labeled (yellow lines). B Fundus autofluorescence (FAF) image of a normal right eye. Note the optic disc and the blood vessels are dark as they do not exhibit autofluorescence. Optical coherence tomography (OCT) section of the retina through the fovea (yellow line in B) is shown. C The photoreceptor nuclei are packed in the hypo-reflective band (arrowhead). The retinal pigment epithelium (RPE) is the linear hyper-reflective band marked by a line. Photoreceptor outer segments (POS) are present in the area between the photoreceptor nuclei layer and the RPE as alternating hyper-and hypo-reflective linear bands (marked with an asterisk). D–I Multimodal imaging in a 7-year-old patient with CLN3 disease. D Fundus photograph showing bull’s eye maculopathy (BEM) outlined with arrowheads. E FAF showing a faint hyperautofluorescent annulus at the margin of BEM (arrowheads). F OCT section through the fovea reveals central loss of the photoreceptor nuclear layer as well as the POS layer. The layers are present towards the periphery on either side of the fovea but the layers are thinner than normal (arrowheads). At follow-up at age 8 years, BEM has enlarged (arrowheads in G), hyperautofluorescent annulus has become more diffuse (arrowheads in H); and the loss of POS and photoreceptor nuclei can be seen across the entire section of the retina (I) with a decrease in overall thickness of the retina as well.

