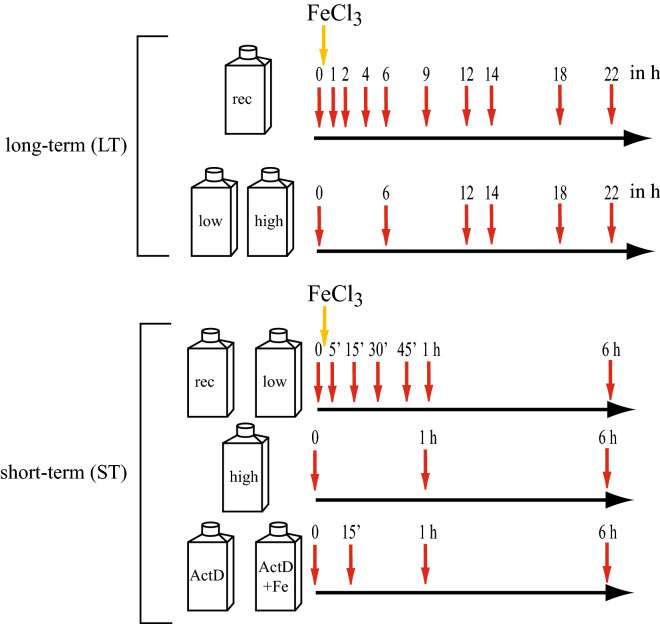
Figure 6.
Experimental overview with sampling times. Shown are the two different experiments that were conducted, the long-term (LT) experiment and the short-term (ST) experiment. The bottles indicate the different treatments that were analyzed in each experiment. Beside the bottles are the sampling times in hours (h). The addition of iron is indicated with a yellow arrow. The iron-recovery (rec) and the ActD+Fe samples were the only samples that received the addition of FeCl3 as indicated.

