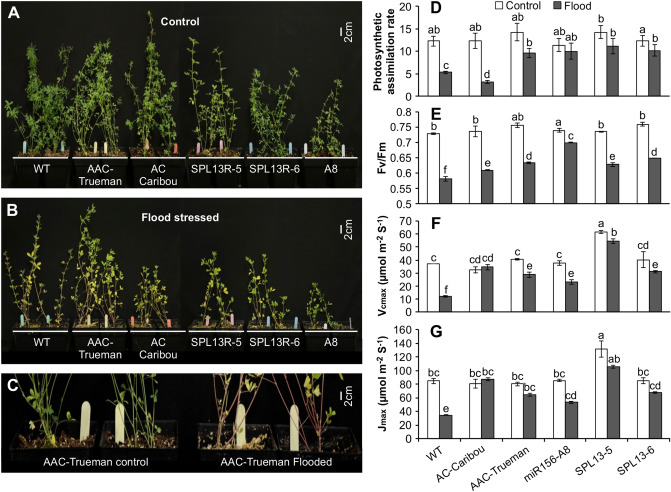
Figure 1.
Physiological responses of flood-stressed and control plants. One-month alfalfa plants growing under (A) control, and (B) flood-stressed conditions, (C) stem colour development in AAC-Trueman plants upon flood stress, (D) photosynthesis assimilation rate in µ mol CO2 m−2 leaf area S−1, (E) chlorophyll fluorescence response, Fv/Fm, (F) Vcmax, the maximum rate of rubisco carboxylase activity, (G) Jmax, maximum photosynthesis electron transport rate. Values are sample means ± SE, n = 8 individual plants. A significant difference from ANOVA was followed by Post hoc Tukey multiple comparisons test and indicated with different letters.

