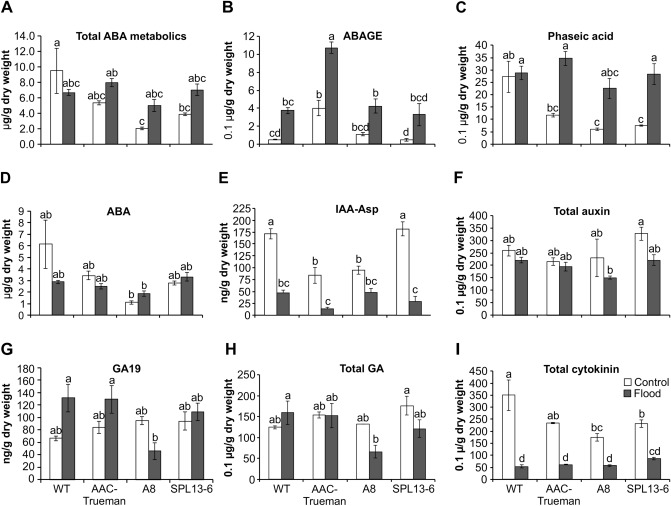
Figure 2.
UPLC/ESI–MS/MS-based hormone profiling in flood stressed and control alfalfa genotypes. (A) The abundance of total abscisic acid, ABA, metabolites (B) abscisic acid glucose ester, ABAGE, (C) phaseic acid, PA, (D) ABA, (E) indole acetic acid-aspartic acid, IAA-Asp, (F) total auxin, (G) gibberellic acid GA19, (H) total gibberellic acid GA, and (I) total cytokinin in ng per gram leaf dry weight. Total ABA metabolites in ‘A’ comprises ABA, Dihydrophaseic acid (DPA), ABAGE (Abscisic acid glucose ester), Phaseic acid (PA), 7′-Hydroxy-abscisic acid (7′OH-ABA), neo-Phaseic acid (neo-PA), and trans-Abscisic acid (t-ABA). Total auxin in ‘F’ comprises Indole-3-acetic acid (IAA) and N-(Indole-3-yl-acetyl)-aspartic acid (IAA-Asp). Total gibberellic acid in ‘H’ comprises gibberellin 8, 9, 19, 20, 24, 29, 34, 44, 51, and 53. Total cytokinin in ‘I’ comprises (trans) Zeatin-O-glucoside (t-ZOG), (cis) Zeatin-O-glucoside (c-ZOG), (cis) Zeatin riboside (c-ZR), Dihydrozeatin riboside (dhZR), Isopentenyladenosine (iPR), Values are sample means ± SE, n = 3 individual plants as biological replicates. A significant difference from ANOVA was followed by Post hoc Tukey multiple comparisons test and indicated with different letters.

