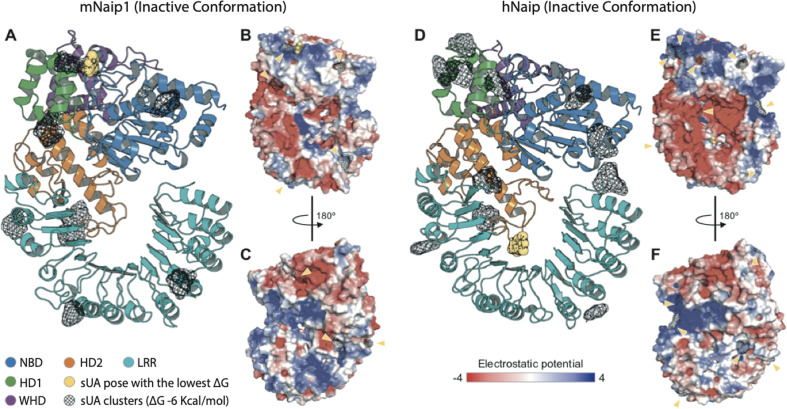
Fig. 5. Structural analysis of the inactive conformations of hNaip and mNaip1, modelled by homology using an inactive form of Nlrc4 structure (PDB 4KXF) as a template.
A Cartoon representation of a mNaip1 (Uniprot: Q9QWK5) homology model. The distinct colours represent functional regions commonly found in proteins of the NLR family (NBD-HD1-WHD-HD2-LRR), coloured as shown in Zhang et al.57. Clusters of uric acid (URC) molecules are shown as black meshes, which represent points on the Naip surface where two or more URC were found to bind, in multiple independent rigid docking simulations. The pose with the lowest ΔG is shown as a yellow sphere representation. B Surface electrostatic potential calculated for mNaip1. Its solvent-accessible surface is shown with a potential gradient ranging from <−4 kBT (red) to >4 kBT (blue). Yellow arrows highlight URC clusters shown in panel (A). C A 180° rotation of mNaip1 around its Y-axis. D Cartoon representation of a hNaip (Uniprot: Q13075) homology model. E Its surface electrostatic potential. F A 180° rotation of hNaip around its Y-axis. See legend for more details.

