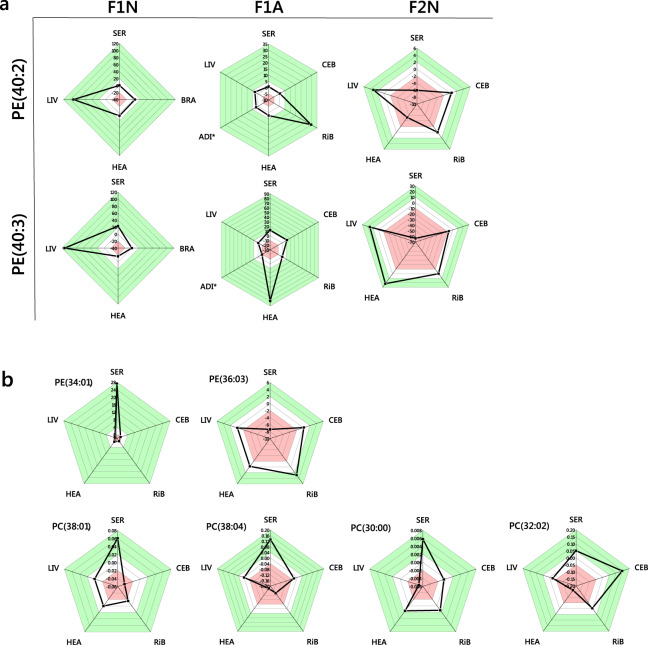
Fig. 6. Radar plots of the Error Normalised Fold Change in abundance of phosphatidylcholine and phosphatidylethanolamine lipid variables associated with a high carbohydrate dietary intake of (grand)sires.
a PE(40:2, 40:3) were identified as more abundant in F1N livers using statistical approaches, this was followed through all generational groups; b PC and PE variables whose abundance in the CNS changes in a manner associated with the dietary phenotype. The white areas represent the 0 point and one division above and below this. The red areas represent values more negative, and the green areas values more positive than this. ADI, adipose; BRA, brain; CEB, cerebellum; HEA, heart; LIV, liver; RiB, right brain; SER, serum. PC, phosphatidylcholine; PE, phosphatidylethanolamine. *Sample treated with petroleum spirit to concentrate phospholipid fraction (see ‘Methods’).

