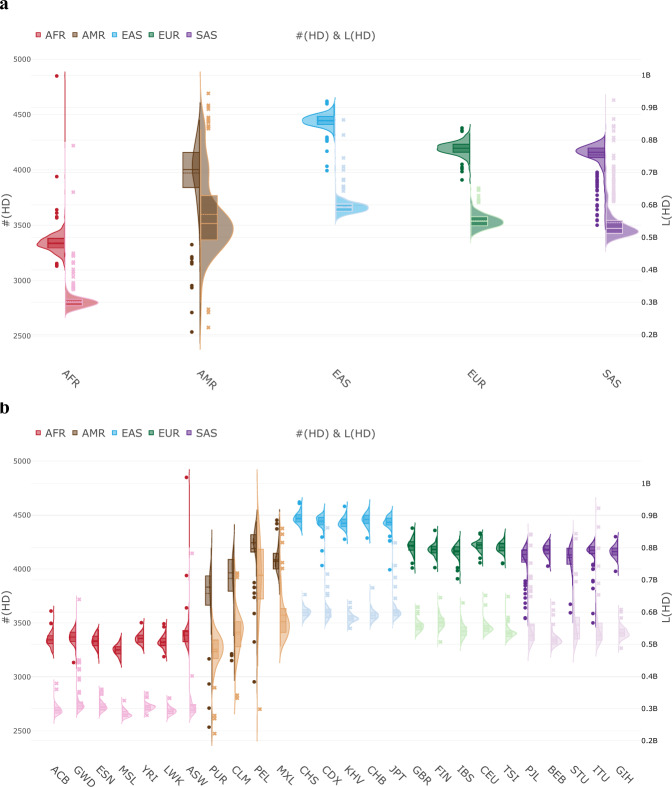
Fig. 6. Genome-wide distributions of the number and length of regions of HD.
a Distributions of HD in the five continental ancestry groups. b Distributions of HD in all populations in the five continental ancestry groups. For each continental ancestry group or population, the number of regions of HD, i.e., #(HD), is displayed on the left-hand side of a violin plot with respect to the left y-axis. The length of regions of HD, i.e., L(HD), is displayed on the right-hand side of a violin plot with respect to the right y-axis. Sample size n = 2504 individuals.

