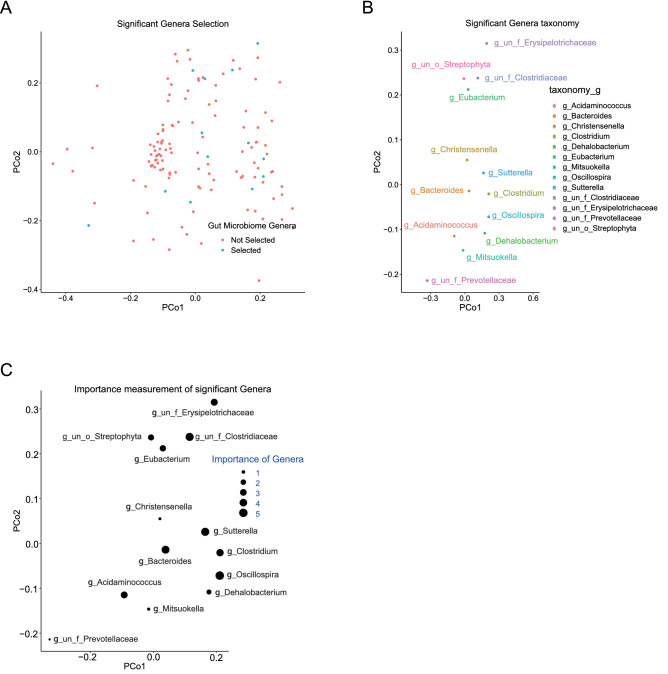
Figure 3.
Taxonomic assessment of genus microbiota signature for HBeAg seroconversion. Axes represent the two first components from principal coordinate analysis (PCoA) based on the phylogenetic distance between genus representative sequences. (A) Thirteen genera (blue dots) are selected out from 169 genera using random forest while red dots represent unselected genera. (B) Taxonomic assignation of the significant genera at genus level. (C) The importance of significant genera is sized by the respective dot.

