Figure 4.
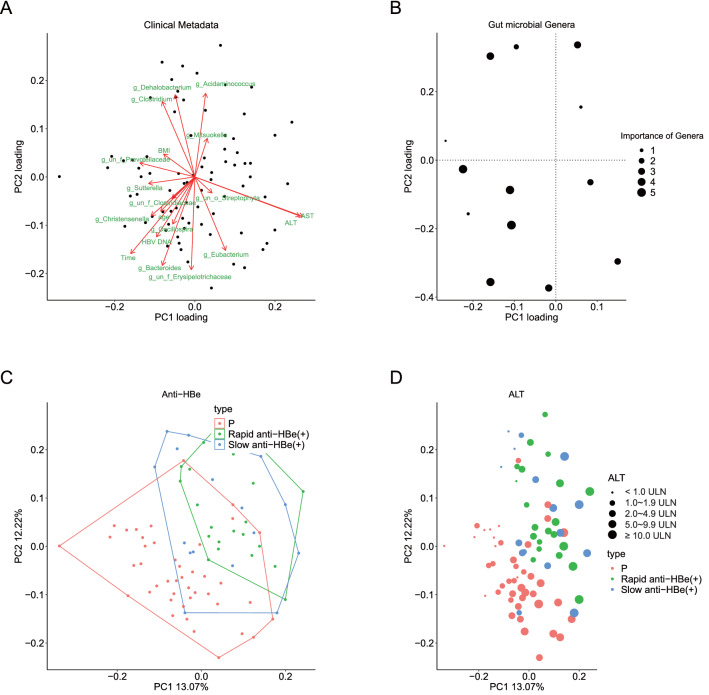
Interactions between clinical, microbial ecology parameter and microbial signatures for HBeAg seroconversion. A co-inertia analysis is performed between the relative abundance of microbial signature genera for HBeAg seroconversion and clinical parameters. (A) Scatter plot of the first two PC loadings of clinical data. Each clinical parameter and microbial signature are labelled in red. (B) Scatter plot of the first two PC loadings for the importance of microbial signatures. Size accounts for the importance. (C,D) Scatter plot of the first two components of co-inertia analysis. Each dot represents a fecal microbiota sample. Orange dots represent the subjects that remained HBeAg positive even after more than 3 years of oral antiviral therapy (Group P), while green dots represent the subjects that achieved HBeAg seroconversion in less than 12 months after the initiation of oral antiviral therapy [Rapid anti-HBe (+)], and blue dots represent the subjects that achieved HBeAg seroconversion later than 12 months after the initiation of oral antiviral therapy [Slow anti-HBe (+)]. (C) Using random forest based on the microbial signature and clinical data of Group P and Group N patients, rapid anti-HBe (+) and Group P are well separated. (D) Baseline ALT has a positive relation with HBeAg seroconversion. Size represents the value of ALT.

