Figure 5.
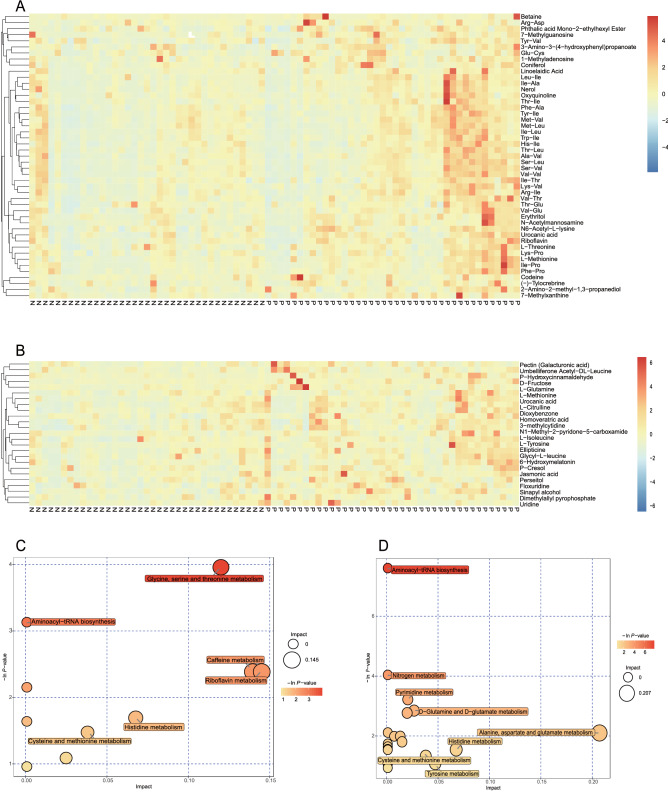
Correlation between differentiated metabolites and HBeAg seroconversion. The differentiated metabolites are defined as P < 0.05 (Student's t-test), combined with variable importance in the projection of the first principal component is greater than 1 in the model of orthogonal projections to latent structures-discriminant analysis. The differentiated metabolites are clustered by using complete linkage method and are displayed as a heatmap of hierarchical clustering analysis with the abscissa represents the different experimental cohorts while the ordinate represents the differentiated metabolites. The color blocks at different positions represent the relative expression of the specific metabolites at the corresponding positions. (A) Heatmap of hierarchical clustering analysis under positive ion (POS) mode. (B) Heatmap of hierarchical clustering analysis under negative ion (NEG) mode. Using KEGG database, differentiated metabolites are mapped to related metabolic pathways, which are shown in a bubble plot. Each bubble in the bubble diagram represents a metabolic pathway. Size of bubble indicates the influence factor of a specific metabolic pathway in topological analysis. The size is larger when the influence factor is higher. The ordinate and the color of bubble indicate the enrichment analysis. The bubble is darker when P value (expressed in minus natural logarithm, i.e., − ln P-value) is more significant in analysis. (C) Enrichment analysis of metabolic pathways under positive ion (POS) mode. (D) Enrichment analysis of metabolic pathways under negative ion (NEG) mode.

