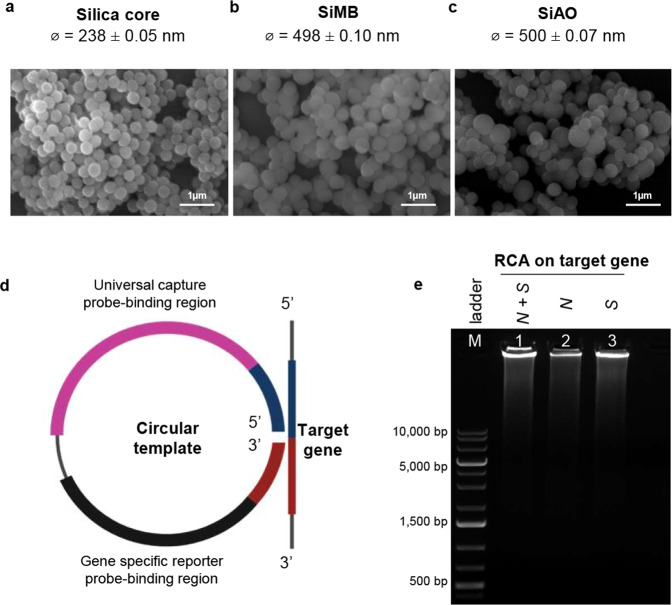
Fig. 2. Visualization of the silica-redox dye and RCA amplicons.
a SEM image with 1 µm scale bar of silica core, b silica-methylene blue (SiMB), and c silica-acridine orange (SiAO) composite particles with diameter sizes (ϕ) which are presented as mean values ± standard deviation (SD), n = 10. d Target gene, universal capture probe, and gene-specific reporter probe binding regions on the circular DNA template. e Gel representation of RCA amplicons visualized on 0.8% agarose gel electrophoresis (n = 3). Lane M indicates the 1 kb DNA ladder, while lanes 1, 2, and 3 indicate the RCA amplicons of both N and S genes, N gene only, and S gene only, respectively. Source data are provided as a Source Data file.

