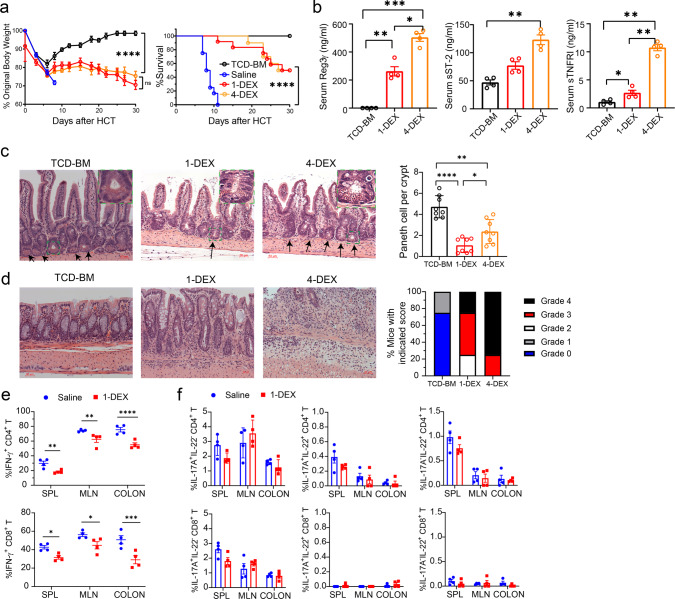
Fig. 1. Establishing a murine model of steroid-resistant acute gut GVHD (SR-Gut-aGVHD).
Lethally irradiated WT BALB/c recipients were engrafted with splenocytes containing 1.5 × 10⁶ T cells together with T cell depleted bone marrow (TCD-BM) (2.5 × 10⁶) from WT C57BL/6 donors. Recipients were given a single iv injection of dexamethasone (DEX, 5 mg/kg) on day 3 (1-DEX) or four total injections on days 3, 10, 15, and 20 (4-DEX) after HCT, with saline used as control. a Plots of means ± SEM of %Original bodyweight of each individual mice at each time point and recessive curve of %survival. n = 8 (TCD-BM), 10 (4-DEX), 12 (Saline & 1-DEX) from two replicate experiments. b Recipient serum concentrations of Reg3γ, ST2, and sTNFRI were measured on day 25 after HCT. Means ± SEM are shown, n = 4 combined from two replicate experiments. c, d Histopathology of small intestine and colon was evaluated day 25 after HCT. Representative micrographic photos of small intestine (original magnification, ×200), and means ± SEM of the numbers of Paneth cell per crypt are showed in c. Representative micrographic photos of colon (original magnification, ×200) and % mice with indicated histopathological scores are shown in d. n = 8 biologically independent mice per group combined from two replicate experiments. e, f Cytokine profile of T cells from SPL (spleen), MLN (mesenteric lymph node), and colon were measured on day 7 after HCT. Means ± SEM of %IFN-γ+ cells among CD4+ and CD8+ T-cell subsets are shown in e, and means ± SEM of %IL-17A+IL-22−, IL-17A+IL-22+ and IL-17A−IL-22+ cells among CD4+ and CD8+ T-cell subsets are shown in f. n = 4 combined from two experiments. Each dot represents one mouse. Nonlinear regression (curve fit) was used and a two-tailed p value was calculated for bodyweight comparisons. Log-rank test was performed with two-tailed p value for survival comparisons. One-way ANOVA with Tukey’s multiple comparisons test, with the Greenhouse-Geisser correction was used for the comparisons in b, c; unpaired two-tailed Student’s t test corrected for multiple comparisons using the Holm–Sidak method was used to compare means in e. a ****p < 0.0001; b, Reg3γ: * p = 0.0133, **p = 0.0086, ***p = 0.0008; ST2: **p = 0.0073(ST2); sTNFRI: *p = 0.0208, **p = 0.0020(TCD-BM vs 4-DEX), **p = 0.0077 (1-DEX vs 4-DEX); c *p = 0.0371 (TCD vs 4-DEX), **p = 0.0011 (TCD vs 1-DEX), **p = 0.0023 (1-DEX vs 4-DEX); e IFN-γ+CD4+ T: **p = 0.0080 (SPL), **p = 0.0069 (MLN), ****p < 0.0001; IFN-γ+CD8+ T: *p = 0.0291 (SPL), *p = 0.0239 (MLN), ***p = 0.00019.

