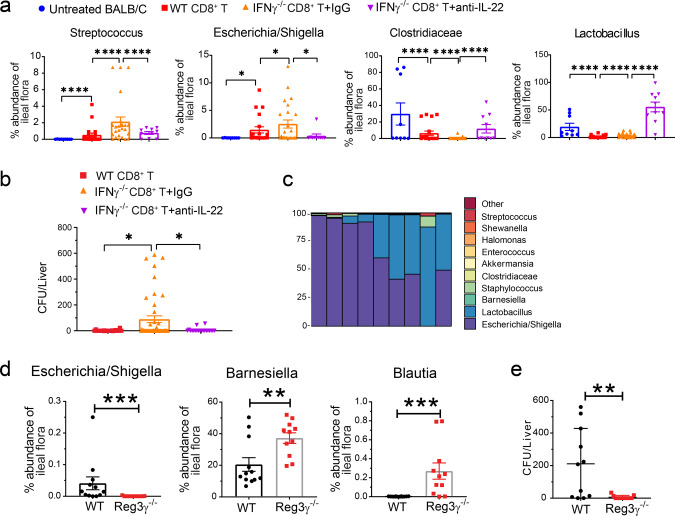
Fig. 6. Tc22 cells cause dysbiosis via IL-22 and Reg3γ.
a–c Gut-aGVHD was induced in BALB/c recipients with grafts from WT or IFNγ−/− C57BL/6 donors as described in Fig. 4a. Recipients of IFNγ−/− grafts were treated with anti-IL-22 mAb or control IgG (150 µg/mouse) every other day from day 0 to day 6 after HCT. Feces from the ileum of untreated BALB/c, recipients of WT CD8+ T, and recipients of IFNγ−/− CD8+ T treated with anti-IL-22 or control IgG were analyzed for microbiome profiles with 16 S RNA-seq on day 6. a %Abundance of Clostridiaceae, Streptococcus, Lactobacillus, and Escherichia/Shigella. Means ± SEM are shown, n = 9 (untreated BALB/c, three replicates), 20 (WT CD8+ T, four replicates), 24 (IFNγ−/− CD8+ T + IgG, five replicates), 10 (IFNγ−/− CD8+ T + anti-IL-22, 2 replicates). b, c Liver suspensions were cultured on three blood agar plates for 24 hours. Means ± SEM of enumerated bacteria colonies from each liver are shown in b. n = 20 (WT CD8+ T & IFNγ−/− CD8+ T + anti-IL-22, four replicates), 45 (IFNγ−/− CD8+ T + IgG, nine replicates). Genus-level bacterial composition of colonies grown from liver suspension of IFNγ−/−CD8+ T recipients are displayed in each bar are shown in c, n = 9. d, e Lethally irradiated WT or Reg3γ−/− C57BL/6 recipients were engrafted with IFNγ−/− BALB/c CD8+ T cells (2.5 × 10⁶) combined with TCD-BM (2.5 × 10⁶) from WT BALB/c donors. Six days after HCT, ileal feces were analyzed with bacteria16S RNA sequencing, and liver cell suspensions were cultured. d %Abundance of Barnesiella, Escherichia/Shigella, and Blautia. Means ± SEM are shown. n = 11 (Reg3γ−/−), 12 (WT). Two replicate experiments. e Mean ± SE of bacteria colony numbers for each liver. n = 11. Two replicates. Each dot represents one mouse, P value was determined by Kruskal–Wallis with Dunn’s multiple comparisons test with two-tailed p value (a), ordinary one-way ANOVA (b), Mann–Whitney test with two-tailed p value (d) and unpaired two-tailed Student’s t test (e). a *p = 0.0362, ****p < 0.0001; b *p = 0.0354 (WT CD8+ T vs. IFNγ−/− CD8+ T + IgG), *p = 0.0443 (IFNγ−/− CD8+ T + IgG vs. IFNγ−/− CD8+ T + anti-IL−22); d ***p = 0.0003 (Escherichia/Shigella); **p = 0.0070; *** p = 0.0004 (Blautia); e **p = 0.0053.

