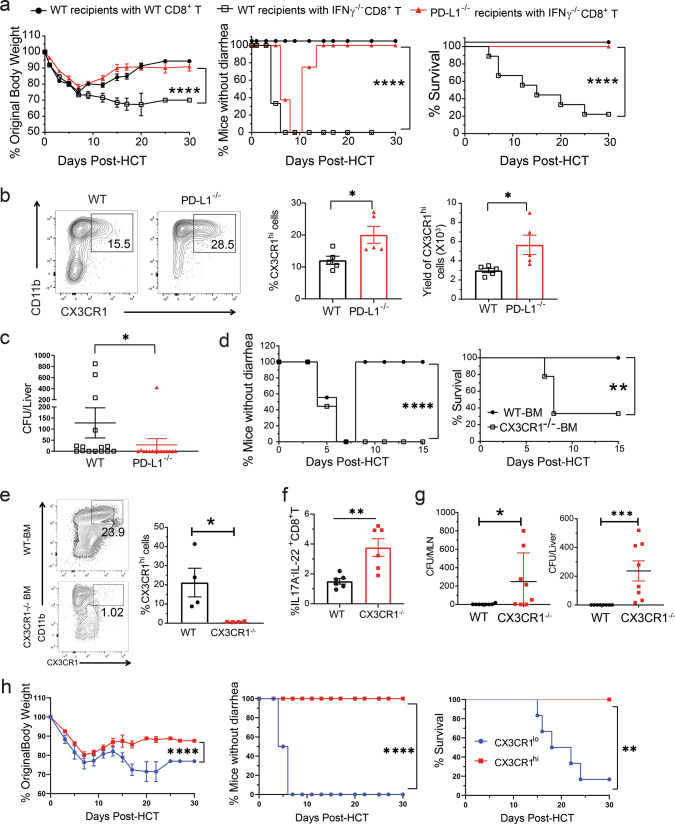
Fig. 9. Gut-aGVHD induced by IFNγ−/−CD8+ T cells is reversed by preservation of donor-type CX3CR1hi MNP.
a–c WT or PD-L1−/− BALB/c recipients were engrafted with IFNγ−/− splenocytes and WT-TCD marrow cells from C57BL/6 donors as described in Fig. 4a. a Mean ± SEM of %original bodyweight at each time point and recessive curves of %mice without diarrhea and %survival among total mice are shown. n = 8 (PD-L1−/− recipients with IFNγ−/− CD8+ T), 9 (WT recipients with WT or IFNγ−/− CD8+ T). Two replicate experiments. b Percentage and yield of CX3CR1hi MNP in colon tissues on day 10 after HCT. One representative staining pattern and means ± SEM are shown, n = 5. Two replicate experiments. c Means ± SEM of bacteria colony numbers in liver suspension cultures from WT or PD-L1−/− recipients 7 days after HCT. n = 15. Three replicate experiments. d–g PD-L1−/− BALB/c recipients were transplanted with sorted IFNγ−/−CD8+ T cells with WT or CX3CR1−/− TCD-BM from C57BL/6 donors. Two replicate experiments. d Recessive curves of %mice without diarrhea and %survival are shown. n = 9. e Representative flow cytometry pattern and %CX3CR1hi MNP in colon tissue. Means ± SEM are shown, n = 4. f Mean ± SEM of %IL17A−IL-22+ CD8+ T cells in MLN on day 7, n = 6. g Bacteria colony numbers in MLN and liver cell suspension from recipients of WT or CX3CR1−/− TCD-BM cells. Means ± SEM of CFU are shown, n = 8. h Splenic CX3CR1hi or CX3CR1lo MNP cells (0.5 × 10⁶) from PD-L1−/−BALB/c recipients of IFNγ−/−CD8+ T on day 10 after HCT were sorted and then iv. injected into WT BALB/c recipients of IFNγ−/−CD8+ T cells on day 1 after HCT. The WT Recipients were monitored for clinical signs of aGVHD for up to 30 days, and mean ± SEM of %original bodyweight at each time point and recessive curves of %mice without diarrhea and %survival among total mice are shown. n = 6 from two replicate experiments. Each dot represents one mouse, P value was determined by nonlinear regression (a, d, h, bodyweight & diarrhea) with two-tailed p value, Log-rank test (a, d, h, survival) with two-tailed p value, nonparametric Mann–Whitney test (c, g) with two-tailed p value, unpaired two-tailed Student’ t test (b, e, f). a ****p < 0.0001; b *p = 0.0271 (%), *p = 0.0329 (Yield); c *p = 0.0104; d **p = 0.0038, ****p < 0.0001; e *p = 0.0336; f **p = 0.0044; g *p = 0.0286, ***p = 0.0002; h **p = 0.0043, ****p < 0.0001.

