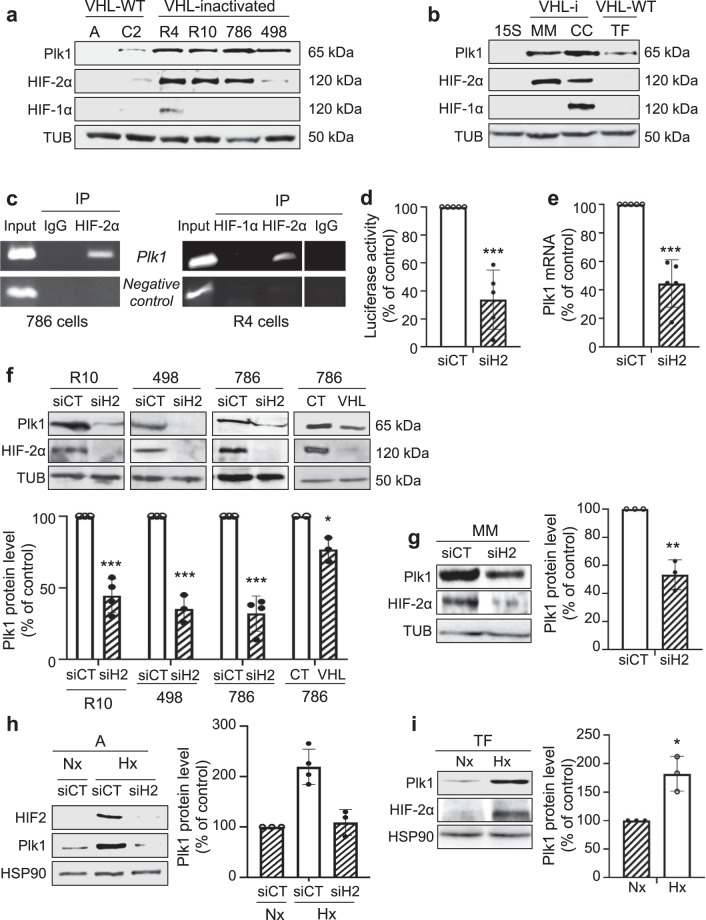
Fig. 2. HIF-2 bond to the Plk1 promoter and regulated its expression in ccRCC cells.
a, b Different RCC cell lines [(ACHN (A), Caki2 (C2), RCC4 (R4), RCC10 (R10), 786-O (786), and A498 (498)] (a) or primary RCC cells (TF, MM, and CC) and healthy renal cells (15S) (b) were evaluated for Plk1, HIF-1α, and HIF-2α expression by immunoblotting. Tubulin (Tub) served as a loading control. c ChIP experiments with HIF-2α and HIF-1α antibodies or negative CT antibodies were performed on extracts from 786 (right) and R4 (left) ccRCC cells. The promoter region of the Plk1 promoter containing the HIF-α binding site was amplified by PCR. Results are representative of three independent experiments. d ccRCC cell lines (VHL-i) 786 were transfected with siRNA against HIF-2α (siH2) for 24 h. Cells were then transfected with a Renilla luciferase reporter gene under the control of the Plk1 promoter. The R. luciferase activity normalized to the firefly luciferase (control vector) was the read-out of the Plk1 promoter activity. e 786 cells were transfected with siRNA against HIF-2α (siH2) for 48 h. The Plk1 mRNA level was determined by qPCR. f, g VHL-i RCC cell lines (R10, 498, 786, f), or primary RCC cells (MM, g) were transfected with siRNA against HIF-2α (siH2) for 48 h. Plk1 and HIF-2α expression was evaluated by immunoblotting. HSP90 served as a loading control. The graphs show the level of Plk1. Control conditions were considered as the reference value (100). h VHL-WT RCC cell lines (A) were transfected with siRNA against HIF-2α (siH2) for 24 h and then were cultured in normoxia (Nx) or hypoxia 1% O2 (Hx) for 24 h. Plk1 and HIF-2α expression was evaluated by immunoblotting. HSP90 served as a loading control. The graphs show the level of Plk1 (mean of three experiments). Control conditions were considered as the reference value (1). i VHL-WT primary RCC cells (TF) were cultured in normoxia (Nx) or hypoxia 1% O2 (Hx) for 24 h. Plk1 and HIF-2α expression was evaluated by immunoblotting. HSP90 served as a loading control. The graphs show the level of Plk1 (mean of three experiments). Control conditions were considered as the reference value (1). Results are the means of three or more independent experiments (biological replication) represented as mean ± SEM. Statistics were determined using an unpaired Student’s t test: *p < 0.05, **p < 0.01, ***p < 0.0001.

