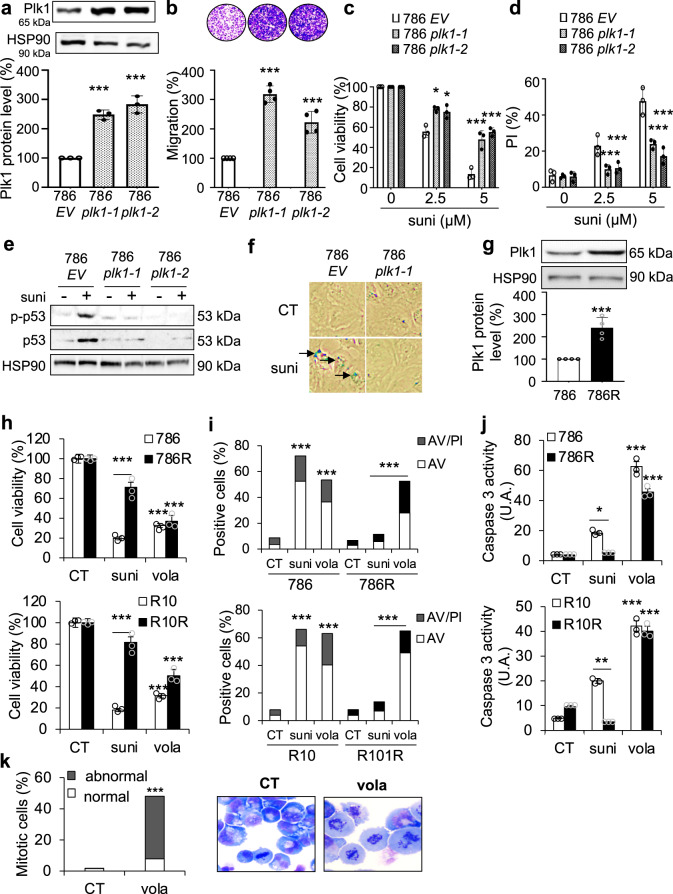
Fig. 4. Over-expression of Plk1 induced aggressiveness, resistance to sunitinib, and its inhibition by volasertib induced cell death.
a 786 cells were transfected with the empty vector (EV) or Plk1 expression vector, and two clones (786 Plk1-1 and 786 Plk1-2) stably expressing Plk1 were selected. Plk1 expression was evaluated by immunoblotting. HSP90 served as a loading control. The quantification of Plk1 expression (mean of three experiments) is shown. The value of the conditions with 786 cells were considered as the reference value (100). b Serum-stimulated cell migration was analyzed using Boyden chamber assays on 786 EV, 786 Plk1-1, and 786 Plk1-2 cells. The level of migration of 786 cells was considered as the reference value (100%). Representative images of the lower surface of the membranes are shown. c, d 786 EV, 786 Plk1-1, and 786 Plk1-2 cells were treated with 2.5 or 5 µM sunitinib (suni) for 48 h. Cell viability was measured with the XTT assay (c). Cell death was evaluated by flow cytometry. Cells were stained with PI. Histograms show PI-positive cells (d). e 786 EV, 786 Plk1-1, and 786 Plk1-2 cells were treated with 2.5 µM suni for 48 h. p-p53 and p53 expression was evaluated by immunoblotting. HSP90 served as a loading control. These results are representative of three independent experiments. f 786 EV and 786 Plk1-1 cells were treated with 2.5 µM suni for 48 h. Senescence were evaluated by β-galactosidase staining. g Plk1 expression was evaluated by immunoblotting in 786 and 786 cells resistant to sunitinib (786R). HSP90 served as a loading control. The quantification of Plk1 expression (mean of three experiments ± SEM) is shown. Plk1 expression in 786 cells served as the reference value (100%). h–j 786 and 786R or R10 and R10R cells were treated with 100 nM volasertib (vola) or 5 µM sunitinib (suni) for 48 h. Cell viability was measured with XTT assays (h). Cell death was evaluated by flow cytometry. Cells were stained with PI and AV. Histograms show AV+/PI− cells (apoptosis) and AV+/PI+ cells (post-apoptosis or another cell death) (i). Caspase-3 activity was evaluated using Ac-DEVD-AMC as a substrate (j). k 786 cells were treated with 100 nM vola for 24 h. Hematoxylin-eosin (HE) staining was done assessment, and the number of cells with normal and abnormal mitosis was evaluated. Results are the means of three or more independent experiments (biological replication) represented as mean ± SEM. Statistics were determined using an unpaired Student’s t test: *p < 0.05, ***p < 0.001.

