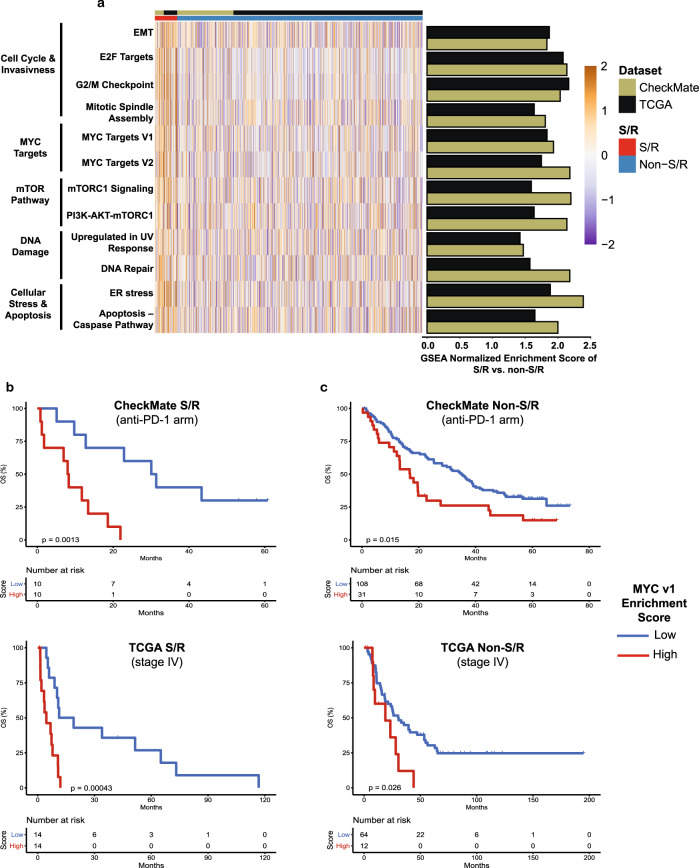
Fig. 2. Transcriptional profiling of S/R RCC reveals the molecular correlates of its poor prognosis and identifies subsets of non-S/R tumors associated with a poor prognosis.
a Heatmap and bar plots of the ssGSEA scores and GSEA normalized enrichment scores for the non-immune “Hallmark” gene sets that were found to be significantly enriched (q < 0.25) in S/R compared to non-S/R RCC in both the TCGA and CheckMate cohorts independently. P-value calculated using a phenotype permutation-based two-sided test with 1000 permutations. Adjustments for multiple testing (50 “Hallmark” gene sets) were made using the false discovery rate (FDR) method. b Kaplan–Meier curves for OS by MYC v1 score within the S/R group of the CheckMate (anti-PD-1 arm) and TCGA (stage IV) cohorts; MYC v1 score dichotomized at the median. Log-rank test two-sided p-value reported without adjustment for multiple testing. c Kaplan–Meier curves for OS by MYC v1 score within the non-S/R group of the CheckMate (anti-PD-1 arm) and TCGA (stage IV) cohorts; MYC v1 score dichotomized at the median of the S/R group. Log-rank test two-sided p-value reported without adjustment for multiple testing. EMT: Epithelial Mesenchymal Transition; MYC v1: MYC Targets Version 1; S/R: Sarcomatoid/Rhabdoid; TCGA: The Cancer Genome Atlas.

