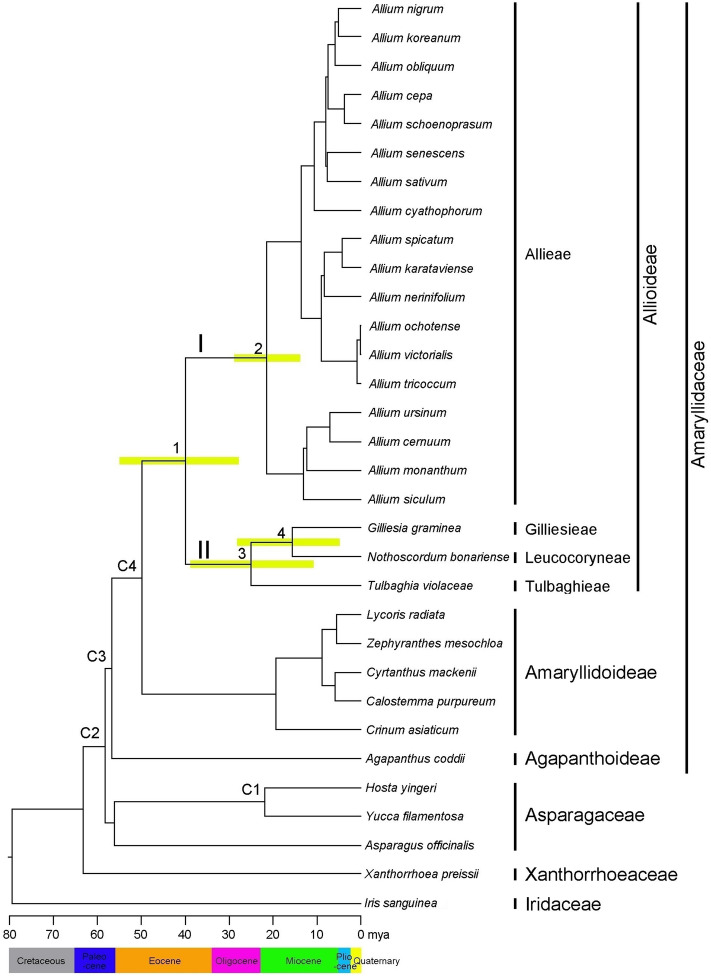
Figure 3.
Chronogram showing divergence times estimated using BEAST based on data from 74 cpDNA sequences. Divergence times are shown for each node. Yellow bars represent 95% highest posterior density values for the estimated mean dates. The clades (I and II) correspond to those shown in Fig. 4. Nodes labelled C1–C4 are calibration points used for analysis (for details, see “Materials and Methods”). Numbers 1–4 indicate nodes of interest (for details, see Table 2).

