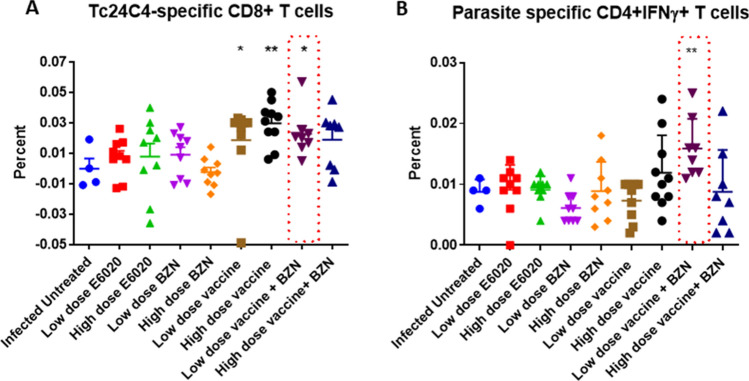
Figure 2.
Cellular immune response against T. cruzi antigens. Spleen cell cultures were stimulated for 96 h and stained with fluorescent antibodies for further flow cytometry analysis. (A) Frequency of Tc24-C4 antigen-specific CD8 + T cells for the different experimental groups. (B) Frequency of total parasite antigen-specific CD4 + IFNγ + T cells for the experimental groups. *P ≤ 0.05, ** P ≤ 0.005 indicate difference when comparing groups to the infected untreated control.

