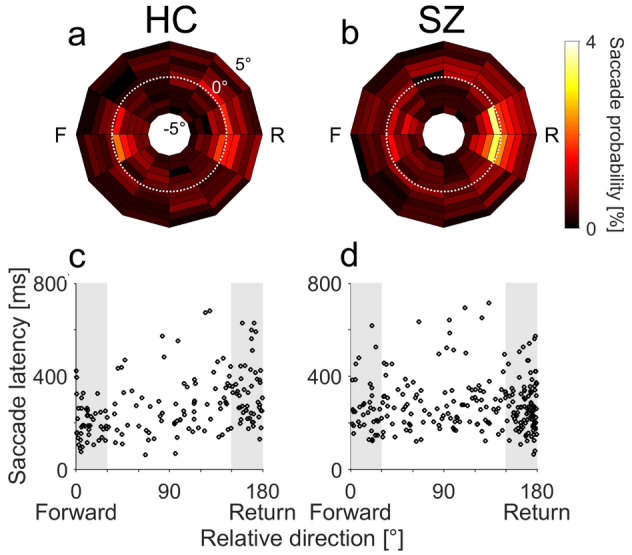
Figure 2.

(a,b) The distributions of the amplitudes and directions of individual saccades relative to their respective one-back saccades for a representative HC (a) and SZ (b). Probabilities of saccades with different directions (denoted by the angles of the polar plots; 30° bins) and amplitudes (denoted by the radius; 1° bins, range − 5° to 5°) relative to the preceding saccades are shown as heatmaps. White dotted lines represent an amplitude difference of 0°, indicating that a saccade has the same amplitude as the preceding saccade. F and R indicate forward and return directions, respectively. (a) The HC made both return and forward saccades more frequently than saccades in other directions. (b) The SZ exhibited more return saccades than forward saccades. (c,d) The saccade latencies are plotted against the relative saccade directions for amplitude-matched (< 1°) sequential saccades for the same HC (c) and SZ (d). Data within the shaded areas are defined as forward (left) and return (right) saccades.
