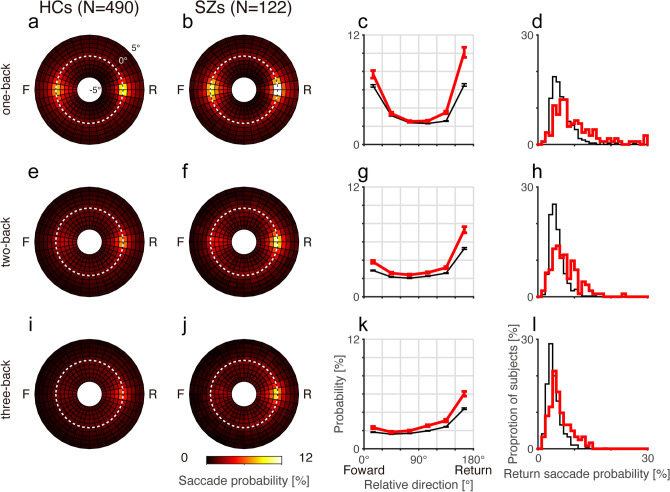
Figure 3.
Mean saccade probability maps for the one-back (top), two-back (middle), and three-back (bottom) fixation locations for HCs (a,e,i) and SZs (b,f,j). Conventions are the same as in Fig. 2a,b. (c,g,k) Mean saccade probabilities plotted against relative saccade directions for amplitude-matched saccades for HCs (thin black lines) and SZs (thick red lines). Error bars indicate standard errors. (d,h,l) Frequency histograms of the return saccade probability for HCs (thin black lines) and SZs (thick red lines).

