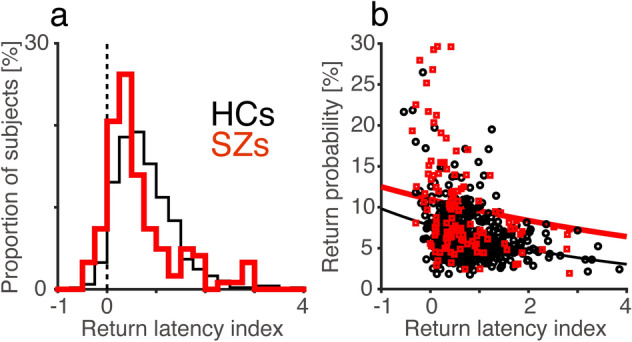
Figure 4.

Relationship between return saccade probability and return latency index. (a) Frequency histograms of the return latency index for HCs (N = 490, thin black line) and SZs (N = 122, thick red line). (b) The relationship between the return saccade probability and return latency index for HCs and SZs. GLM analysis showed significant effects of the return latency index (coefficient = − 0.23 ± 0.03, t = − 6.8, p < 0.001) and group (coefficient = 0.34 ± 0.06, t = 5.4, p < 0.001), but not of the interaction (coefficient = 0.10 ± 0.06, t = 1.7, p = 0.09). Thin black and thick red lines represent regression lines estimated by the GLM model for HCs and SZs, respectively.
