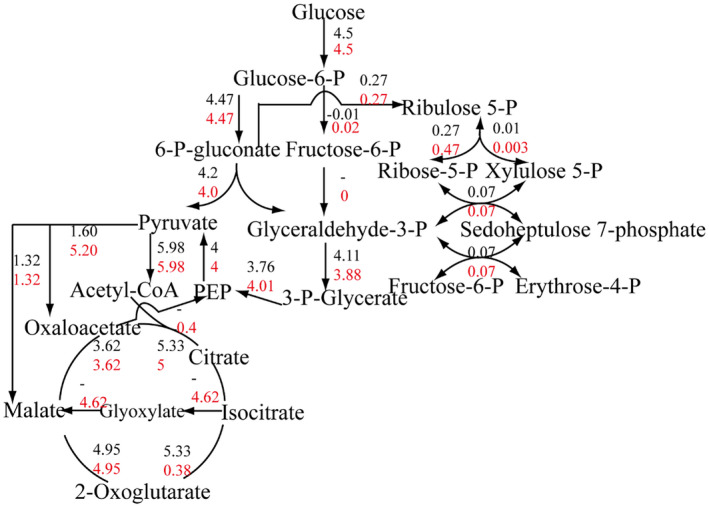
FIGURE 3.

Comparison of central metabolic flux distributions between the model predictions and the published data. Values in black are the flux from the literature; values in red are the flux from the model iNX1344. “−” represents no associated value in the literature. Estimated fluxes in the iNX1344 and the literature are expressed in mmol·g −1 dry weight·hr−1
