Fig. 2.
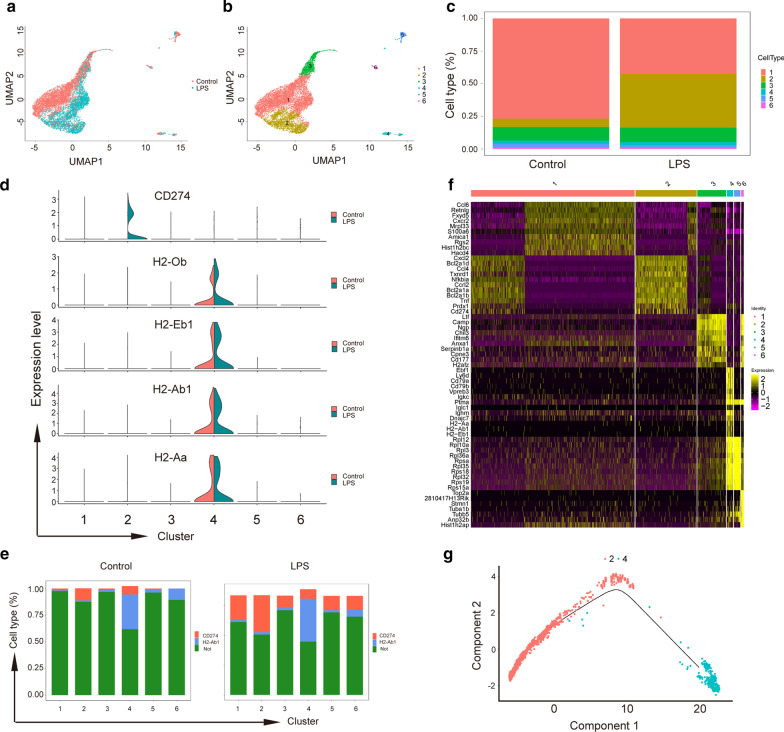
scRNA-seq uncovers neutrophil transcriptional heterogeneity after LPS stimulation. a UMAP representation of gene expression data in 9421 neutrophils, including the control and LPS-stimulated cells. b Seurat cluster assignment projected onto the UMAP plot. c The proportion of each subset of cells in the control group and the LPS stimulation group. d PD-L1 and MHC-II components (H2-Ob, H2-Eb, H2-Ab1, H2-Aa) expression in different clusters. e Bar plot showing the changes in the proportions of neutrophils expressing PD-L1 or MHC-II components (H2-Ab1) in each cluster. f Heat map of significant differential gene in each cluster. g Pseudotime map showed changes in neutrophil differentiation after LPS stimulation

