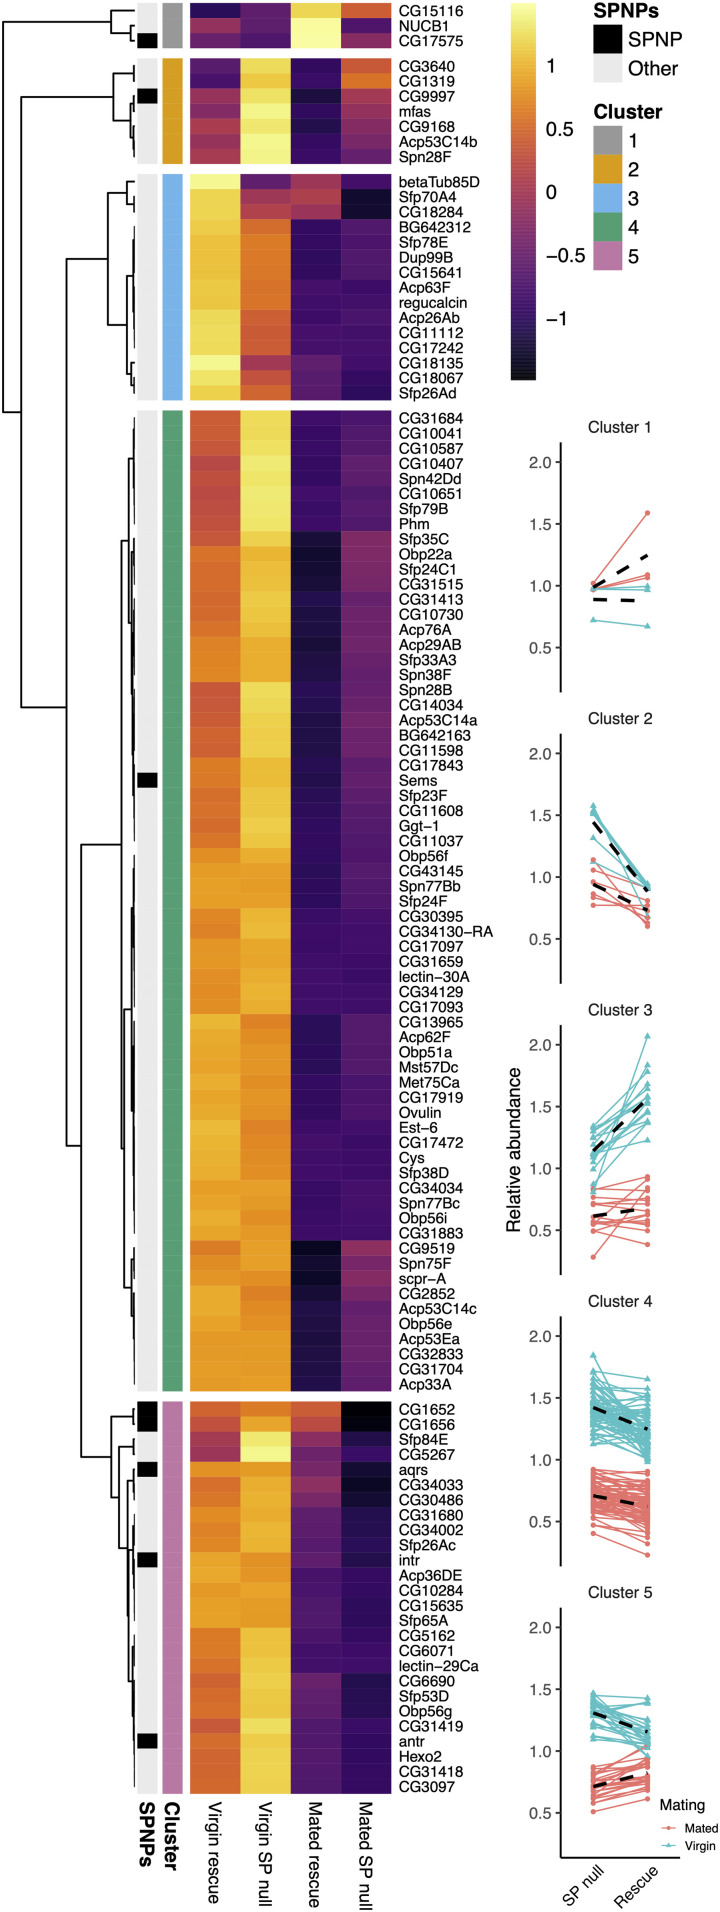
Fig. 6.
SP loss differentially modifies the transfer of specific subclasses of seminal protein. Heat map shows mean log2 abundance taken across three replicates for each SFP. Each protein is plotted for the rescue control virgin (far left) and mated (middle right column), and SP null virgin (middle left) and mated (far right) glands. SP network proteins (SPNPs) are marked (black on the left), in addition to the five clusters. Mean-centered abundance patterns for each protein in clusters 1 to 5 are shown on Right. Red, mated glands; blue, virgin glands. Black dashed lines give the average response for a mating treatment.

