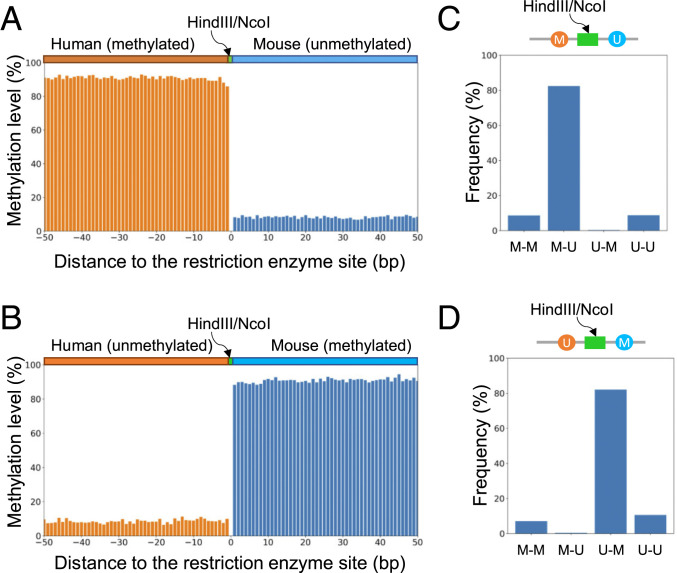
Fig. 3.
Methylation pattern analysis for human–mouse hybrid fragments. (A) Methylation levels across CpG sites from human–mouse hybrid fragments present in the human (meth)–mouse (unmeth) dataset. CpG sites were pooled together according to the relative distance to the nearest base of a restriction cutting site (HindIII or NcoI). (B) Methylation levels across CpG sites from human–mouse hybrid fragments present in the human (unmeth)–mouse (meth) dataset. (C) Methylation patterns for the two nearest CpG sites immediately flanking a restriction cutting site (HindIII or NcoI) for human–mouse hybrid fragments present in the human (meth)–mouse (unmeth) dataset. (D) Methylation patterns for two CpG sites immediately flanking a restriction cutting site (HindIII/NcoI) for human–mouse hybrid fragments present in the human (unmeth)–mouse (meth) dataset. “M-M” represents that the first and second CpG sites in the human and mouse parts are both methylated. “M-U” represents that the first CpG site in the human part is methylated while the second CpG site in the mouse part is unmethylated. “U-M” represents that the first CpG site in the human part is unmethylated while the second CpG site in the mouse part is methylated. “U-U” represents that the first and second CpG sites in the human and mouse parts are both unmethylated.

