Fig. 5.
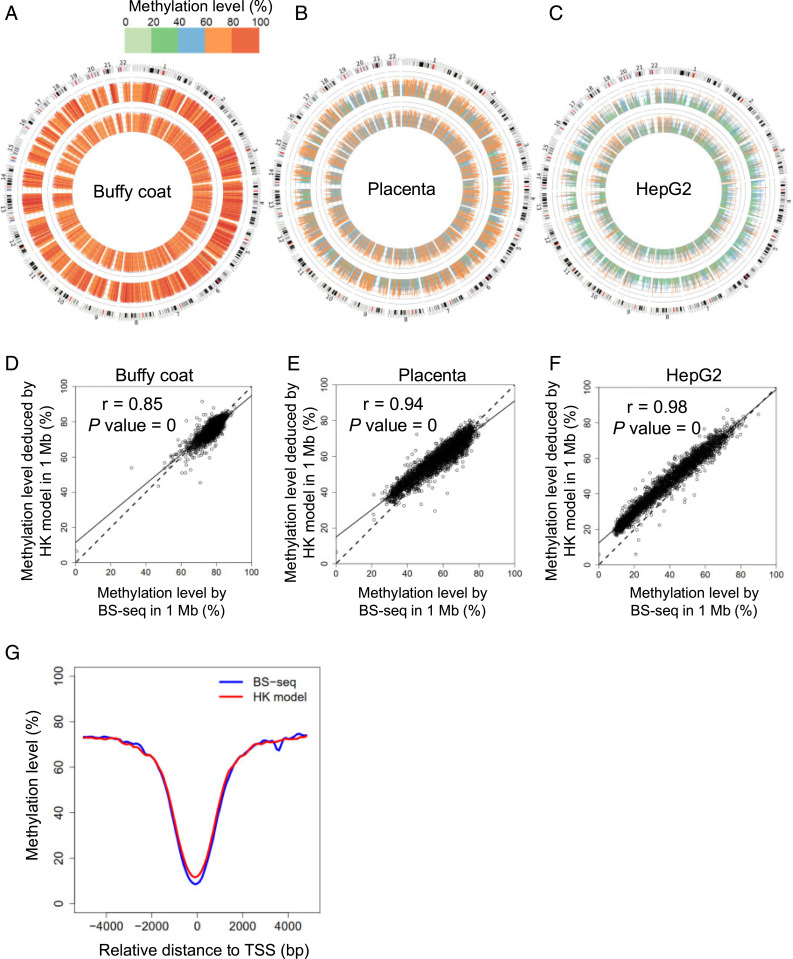
Methylation levels quantified by BS-seq and the HK model at 1-Mb resolution. Circos plots show methylation levels determined by the HK model (inner ring) and BS-seq (outer ring) across different 1-Mb regions of human genome for buffy coat (A), placenta (B), and the HepG2 HCC cell line (C). Scatter plots show correlations of methylation level in each 1-Mb genomic region determined by the HK model and BS-seq for buffy coat (D), placenta (E), and the HepG2 HCC cell line (F). (G) Methylation patterns surrounding TSSs.

