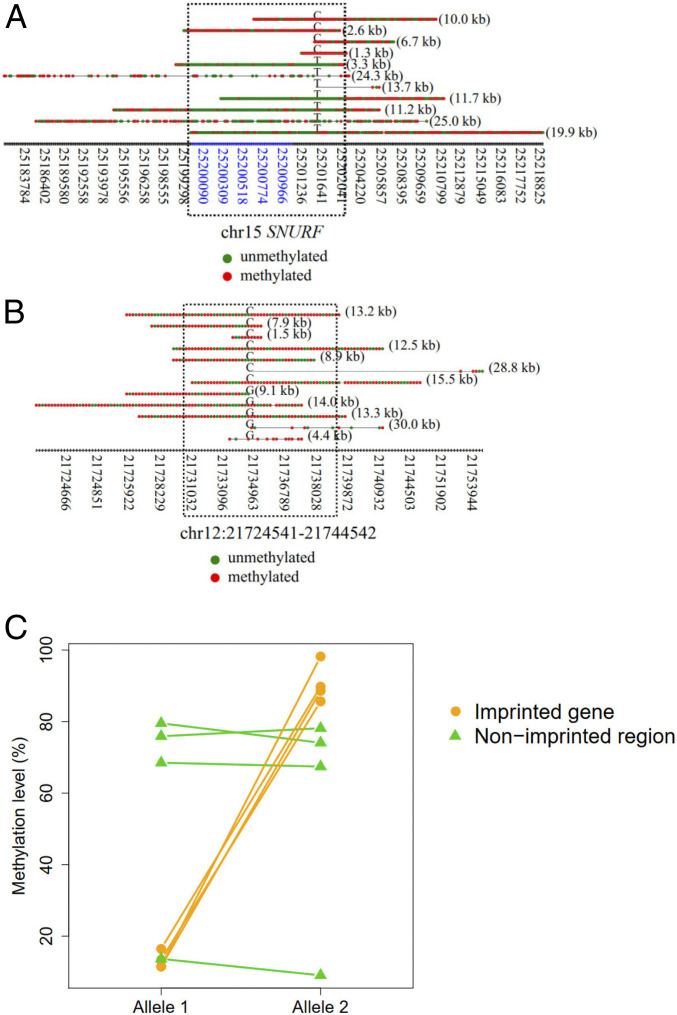
Fig. 7.
Methylation patterns for each single molecule derived from imprinted regions. (A) An example showing the methylation patterns for each DNA molecule in association with imprinted regions of gene SNURF. The x axis indicates the coordinates of CpG sites. The coordinates highlighted in blue indicate CGIs. Red dots indicate methylated CpG sites. Green dots indicate unmethylated CpG sites. The alphabet embedded among each horizontal series red and green dots (i.e., CpG sites) indicates the allele at the SNP site. The numbers in parentheses on the right of each horizontal series of dots indicate the size of a fragment. The dashed rectangle indicates the regions overlapped with the known imprinting control region. (B) An example showing the methylation patterns for each DNA molecule originating from nonimprinted regions. The dashed rectangle indicates a region surrounding the SNP site highlighted for comparison. (C) Methylation levels between imprinted and nonimprinted regions.

