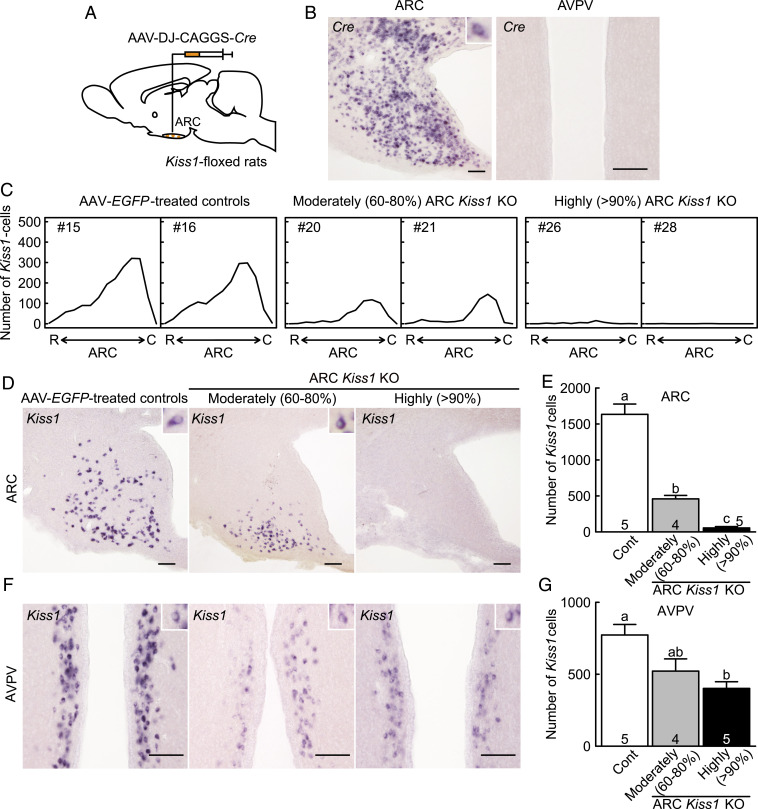
Fig. 5.
Evaluation of conditional ARC Kiss1 KO female rats. (A) Schematic illustration of the injection of AAV-Cre into the ARC. (B) Cre-expressing cells in the ARC and AVPV of a representative OVX + low E2 AAV-Cre–treated Kiss1-floxed rats. (C) Distribution of ARC Kiss1-expressing cells throughout the ARC of two representative OVX + low E2 moderately and highly ARC Kiss1 KO rats and OVX + low E2 AAV-EGFP–treated Kiss1-floxed control rats (Cont). R, the rostral part of ARC and C, the caudal part of ARC. (D) Kiss1-expressing cells in the ARC of representative moderately and highly ARC Kiss1 KO rats and control rat. Insets show representative Kiss1-expressing cells. (E) The number of Kiss1-expressing cells in the ARC. (F) Kiss1-expressing cells in the AVPV of representative animals. (G) The number of Kiss1-expressing cells in the AVPV. Values expressed in the bar graphs are mean ± SEM. Numbers in (or on) each column indicate the number of animals used. The values with different letters were significantly different from each other (P < 0.05) based on one-way ANOVA followed by Tukey's HSD test. (Scale bars, 100 μm.)

