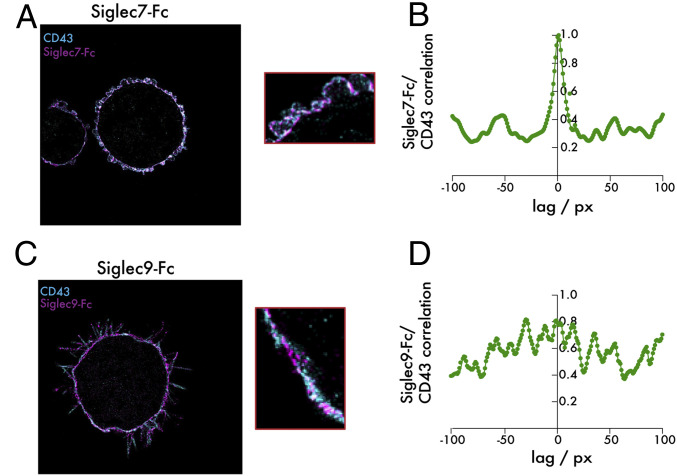
Fig. 3.
Super-resolution imaging reveals selective cell-surface colocalization between CD43 and Siglec-7 ligands. (A) K562 cells were plated onto slides coated with fibronectin and incubated with 1 μg/mL Siglec-7–Fc/Alexa Fluor 647 anti-huIgG (purple) and a CD43-CF568 antibody (blue). An analysis of colocalization was then performed using super-resolution microscopy. (B) A correlation analysis assessing colocalization of Siglec-7–Fc and CD43 signal on the cell surface was performed. (C) The same experiment as in A was performed with Siglec-9–Fc. (D) The same analysis as in B was performed for Siglec-9–Fc. The total edge length of the images is 40.96 microns. One px corresponds to the bin width of the two-dimensional histogram used for the reconstruction, that is, 32 nm.

