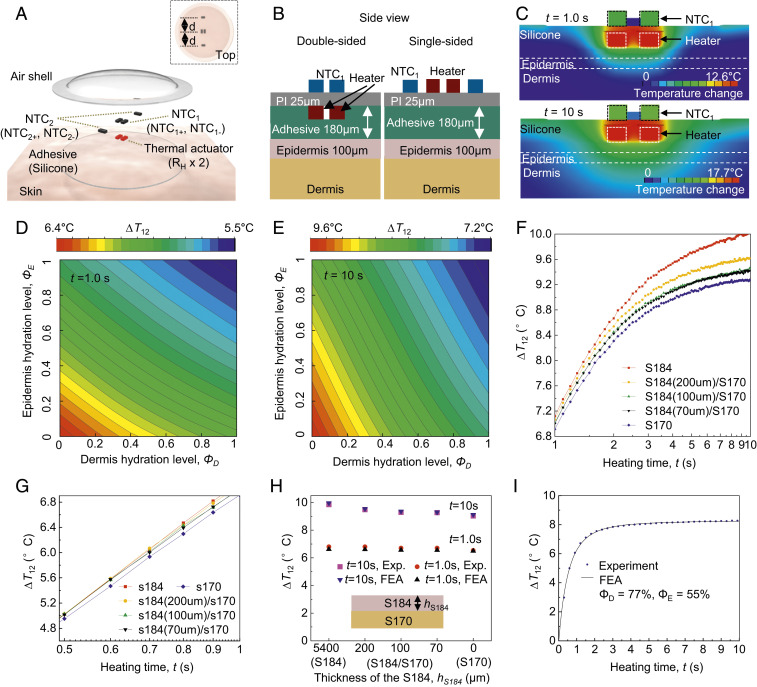
Fig. 2.
Finite-element analysis (FEA) of thermal transport throughout the system as the basis for device optimization and data analysis. (A) Schematic illustration of the thermal actuator (RH × 2) with two pairs of thermistors: NTC1 (NTC1+, NTC1−; resting on the top of the thermal actuator), and NTC2 (NTC2+, NTC2−; resting at the same distance, d, from the actuator). (B) Schematic illustration of the FEA model of dual-sided (Left) and single-sided (Right) sensor designs. (C) FEA results for the temperature distribution of the skin with 50% water by volume, at short (t = 1.0 s; Top) and long (t = 10 s; Bottom) times after initiating thermal actuation (heating power, Q = 20.4 mW). (D and E) Relationship of ΔT12 at short times (t = 1.0 s; D) and long times (t = 10 s; E) to epidermis (ΦE) and dermis (ΦD) hydration levels. ∆T12 = ∆T1 − ∆T2. (F and G) Wireless measurements of ∆T12 at long (F; t = 1 to 10 s) and short (G; t = 0.5 to 1 s) times for samples that consist of a thick layer of PDMS S184 (red) and S170 (blue), and a thin layer of S184 with different thickness (70 μm, black; 100 μm, green; 200 μm, yellow) on the top of the S170. (H) Comparison between FEA and experiment (SD < 3.5%) for PDMS structures described above. (I) FEA curve fits of ∆T12 (SD < 4.5%) measured for the skin (forearm) throughout the entire measurement period (t = 0 to ∼10 s) and the resulting ΦD and ΦE.

