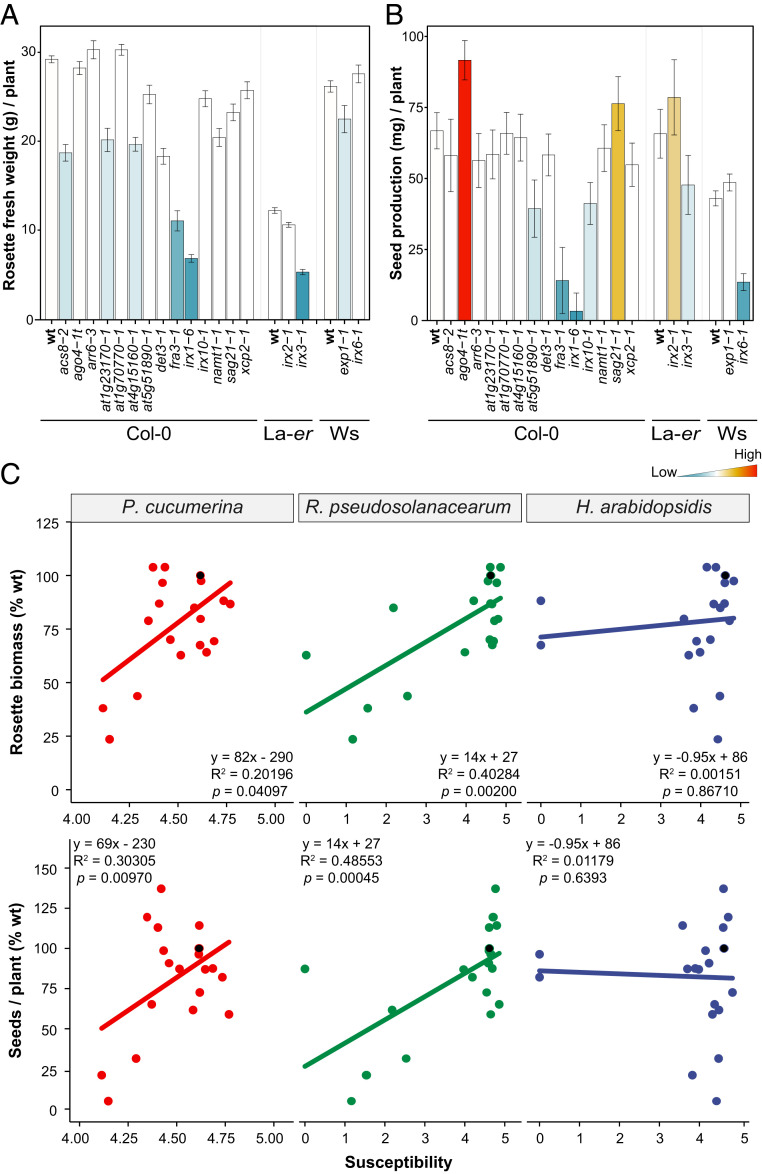
Fig. 2.
Arabidopsis cell wall mutants show associated resistance/fitness trade-offs. (A) Rosette fresh weight biomass (average g/plant ± SD) of 4-wk-old mutants and wild-type (wt) plants (Col-0, La-er, and Ws backgrounds). (B) Seed yield (average milligram/plant ± SD) of wt plants and mutants at the end of reproductive cycle. Data are the average of 10 plants. The column color indicates significant differences compared with wt values (ANOVA nonbalanced analysis and Dunnett’s test, P ≤ 0.05), with higher and lower values than wt indicated in red and blue, respectively. This is one representative experiment of the three performed that gave similar results. (C) Correlation analysis between biotic stress susceptibility to pathogens (Pc, Rp, and Hpa) and fitness parameters (seed yield and rosette biomass) of 18 cwm mutants and wt plants (Col-0, La-er, and Ws backgrounds). The average response information of each genotype (dot in the graph) is expressed in relation to that of the reference wt plant (black dot; value of 100% at the y-axes). Disease resistance susceptibility ratios were log-transformed, and accordingly, x-axes range from 0 (lower susceptibility) to 5 (greater susceptibility), with the wt plants situated at 4.72 = ln (1 + 100). A linear model was fitted for each combination and correlations determined. Fitted equations, R-squares, and P values are indicated in the insets of the graphs. The x-axes of the figures involving Pc are enlarged in the 4 to 5 range for better visualization.

