Fig. 3.
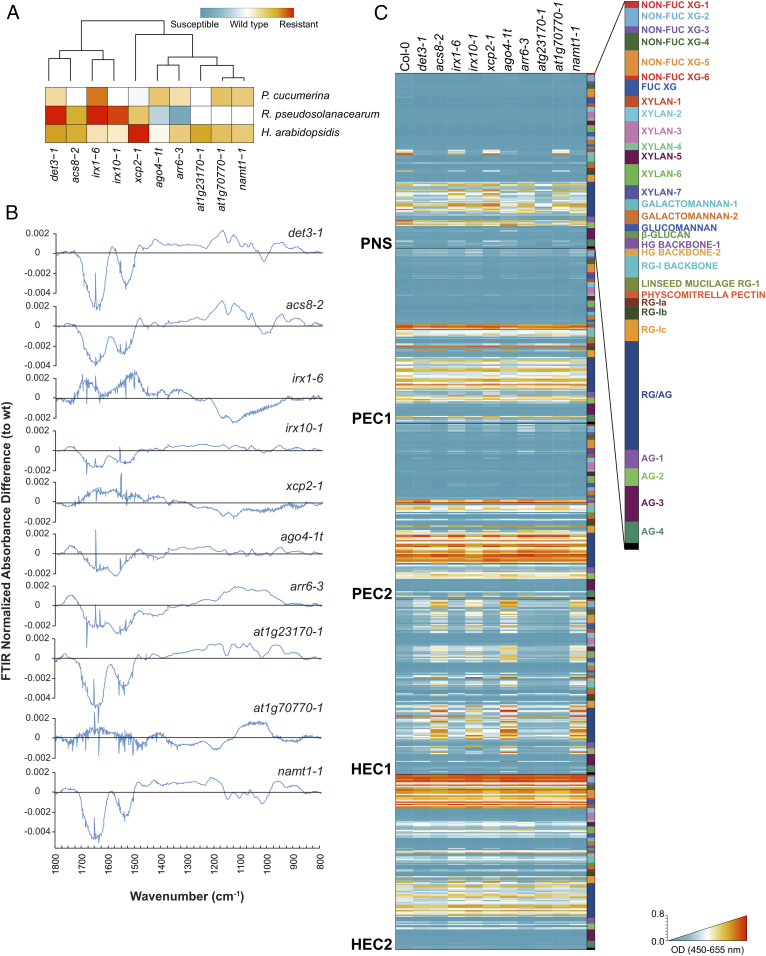
Cell wall analyses by FTIR spectroscopy and glycome profiling of a core set of Arabidopsis cell wall mutants. (A) Selection of a core set of representative mutants with different levels of disease resistance to Pc, Rp, and Hpa. Clusters were computed by Euclidean distances using disease-resistance indexes relative to wild-type (wt) plants. (B) Cell wall FTIR difference spectra of mutants and wt plants (Col-0). The black line indicates wt values, and values over this line are differential FTIR spectra in the mutants tested. (C) Heatmaps of glycome profiling of cell wall extracts (PNS, PEC1, PEC2, HEC1, and HEC2) of cwm and wt (Col-0) rosette leaves of 25-d-old plants (see Dataset S1 for details). Heatmaps depict antibody binding strength based on optical density (OD) indicated as a color gradient ranging from blue (no binding) to red (strongest binding). The list of monoclonal antibodies used for glycome profiling of each fraction and wall structures recognized by them are indicated (Right) (see Dataset S1 for details). Data represent average values of two independent experiments (n > 10).

