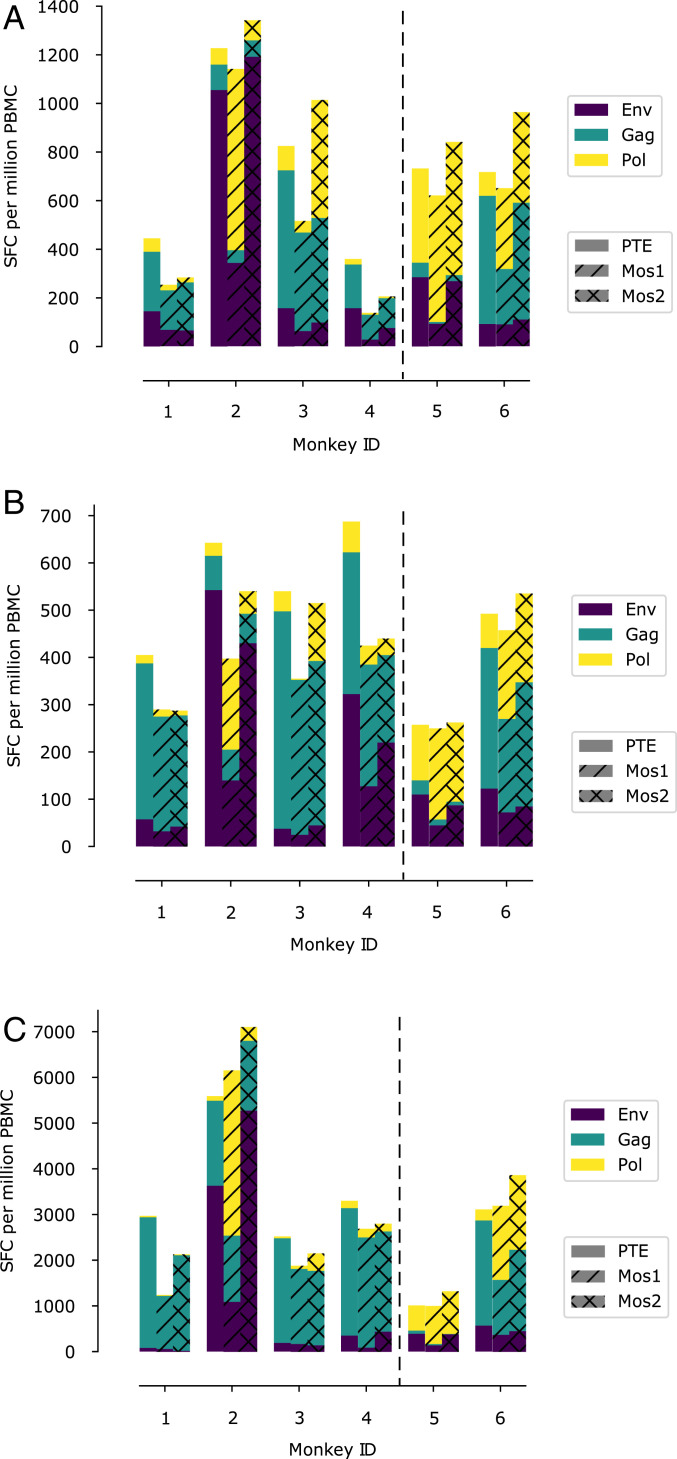
Fig. 3.
Bar graphs showing immunogenicity to various peptide pools for macaques 4 wk after priming (A), 20 wk after priming (B), and 50 wk after priming (C). The first four macaques (1 to 4) were immunized with the immunogen designed by us (Table 1). The last two macaques (5 and 6) were immunized with standard whole protein immunogens. All immunogens were vectored by adenovirus serotypes. The ordinates show the results of ELISPOT assays as the number of spot-forming cells (SFC) per million peripheral blood mononuclear cells (PBMC). The proportion of the response directed toward Gag, Env, and Pol are depicted by the bars colored green, purple, and yellow, respectively. Three different peptide pools (see Methods) were used for the ELISPOT assays: PTE (plane bars), Mos1 (hatched bars), and Mos2 (cross-hatched bars).

