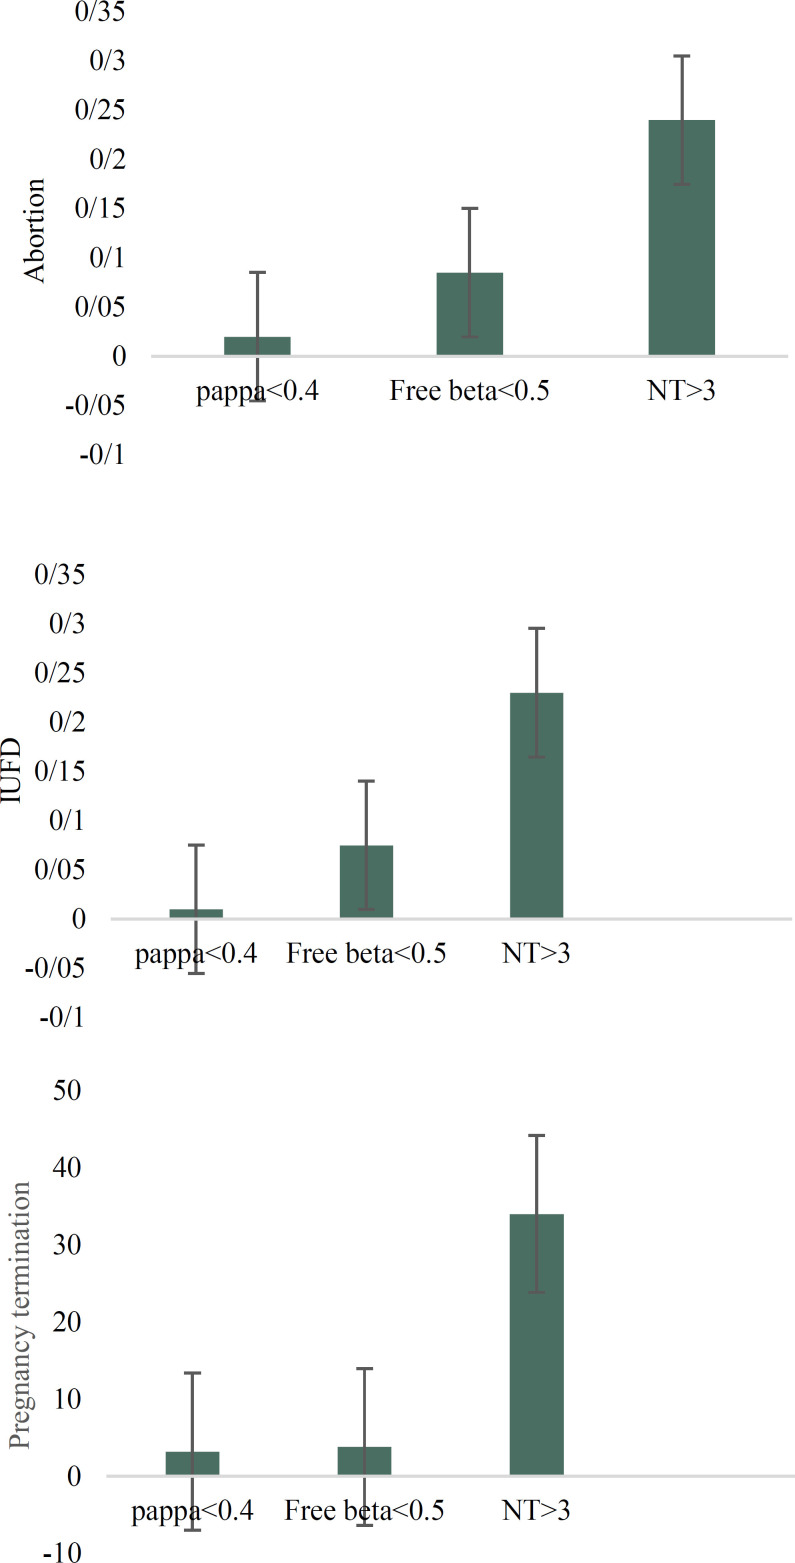
Figure 1.
(a): Shows comparison of frequency of abortion in papp-a≤0.4, free beta hcg. ≤0.5 and NT>3. (b): shows comparison of frequency of IUFD in papp-a≤0.4, free beta hcg. ≤0.5 and NT>3. (c): shows comparison of frequency of elective termination of pregnancy in papp-a≤0.4, free beta hcg. ≤0.5 and NT>3.

