
Figure 1.
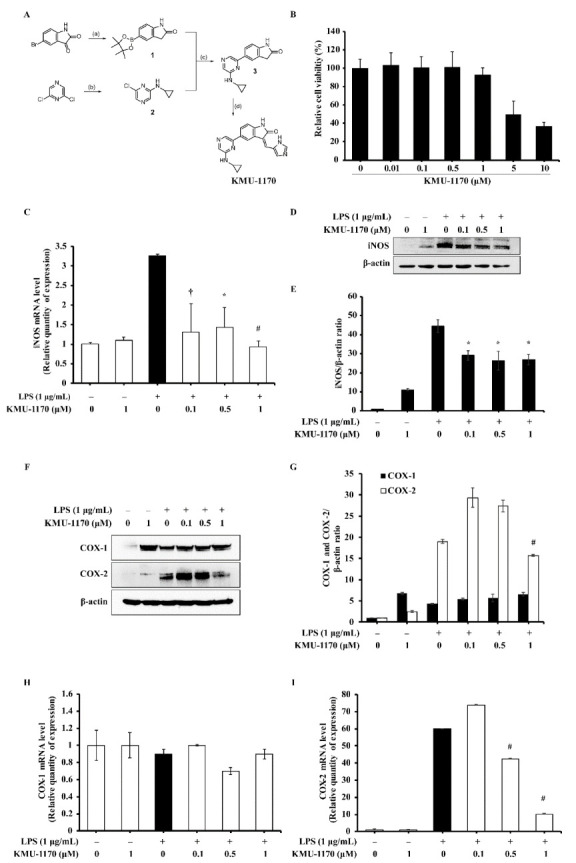
Discovery of KMU-1170, and the effect of KMU-1170 on LPS-induced iNOS and COX-2 in THP-1 cells. (A) Synthetic scheme for the synthesis of KMU-1170. Reagents and experimental conditions: (a) (i) NH2NH2, NaOH, EtOH; (ii) bis (pincholato)diboron, PdCl2(dppf), KOAc, 1,4-dioxane: EtOH(1:1.5), microwave; (b) K2CO3, cyclopropylamine, DMF; (c) PdCl2(PPh3)2, 2M K2CO3, 1,4-dioxane: EtOH (1:1.5), microwave; (d) piperidine, 1H-imidazole-4-carbaldehyde, EtOH, microwave. (B) Cytotoxic effect of KMU-1170 in THP-1 cells was performed by XTT assay. Cell were differentiated into macrophages for 24 h using PMA (100 nM), then the cells were treated with different doses of KMU-1170 (0.01, 0.1, 0.5, 1, 5, and 10 μM) for 24 h. (C–I) Cells were treated with LPS (1 μg/mL) for 6 h after pretreatment with different doses of KMU-470 (0.1, 0.5, and 1 μM) for 1 h. Total RNA was extracted, and used to determine the mRNA expression levels of iNOS, COX-1, and COX-2 (C,H,I, respectively). Whole cell lysates were isolated and used to measure the protein expression levels of iNOS and β-actin by Western blot analysis (D). Image-J software was used to analyze the relative optical density of the iNOS band (E). Whole cell lysates were isolated and used to measure the protein expression levels of COX-1, COX-2, and β-actin by Western blot analysis (F). Image-J software was used to analyze the relative optical density of the COX-1 and Cox-2 band (G). † p < 0.05, * p < 0.01, and # p < 0.001 compared to LPS alone.