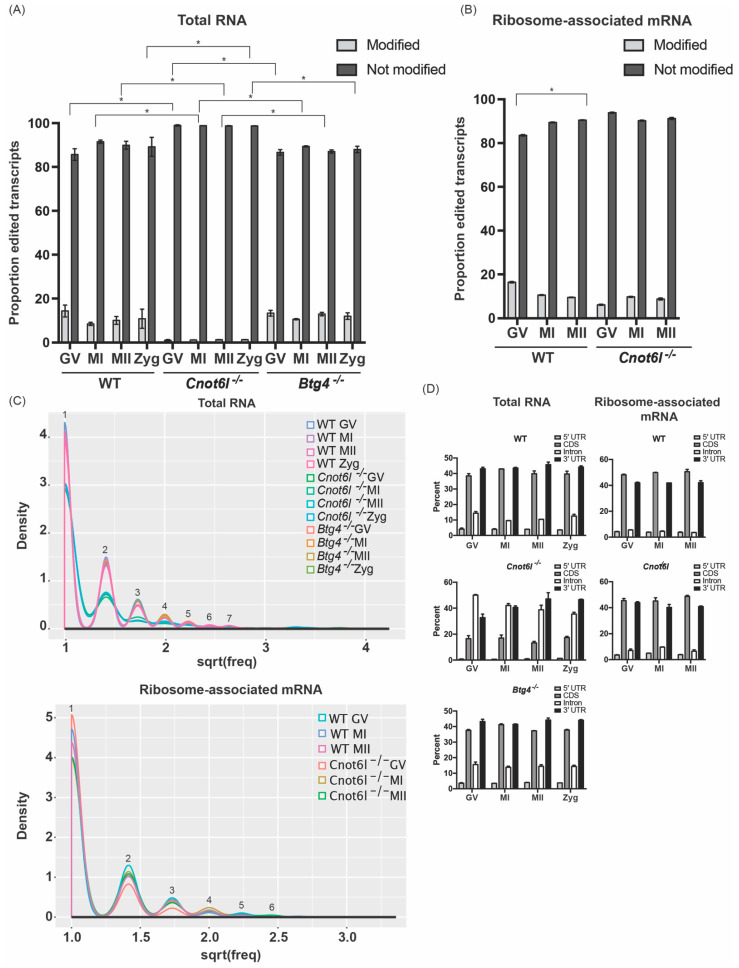
Figure 2.
Distinct pattern of inosine RNA modifications from WT, Cnot6l-/-, and Btg4-/- oocytes, eggs, and zygotes. (A,B) Proportion of the transcriptome (percentage) that contains inosine RNA modifications in total RNA (A) and ribosome-associated mRNA (B). (C) Number of inosine RNA modified transcripts exhibiting one or multiple inosines per transcript in total RNA and ribosome-associated RNA. Numbers above line indicate the number of inosines/transcript. (D) Number of inosine RNA modifications within specific regions (5′ UTR, CDS, intron, and 3′ UTR) in mRNA in total RNA and ribosome-associated RNA. *Means ± SEM within panels A and B are different (p < 0.05); significance was determined using X2 tests. Only transcripts with TPM ≥ 1 were analyzed.

