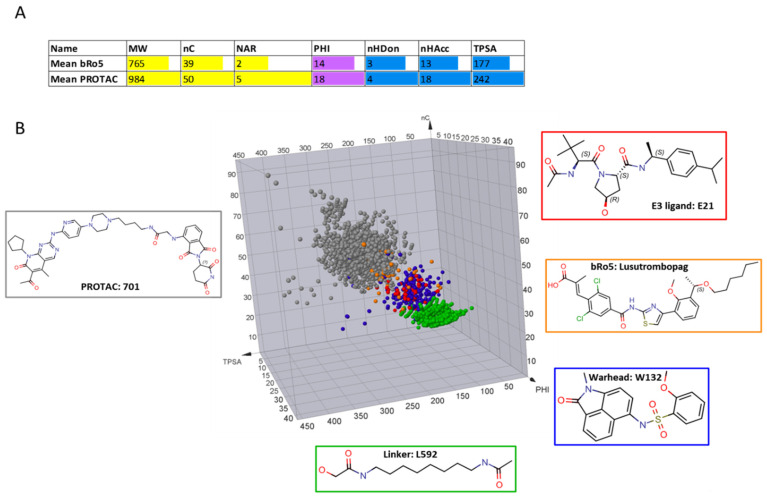
Figure 9.
PROTACs vs bRo5, data taken from [13]. (A) Mean value of the calculated descriptors; (B) 3D plot: nC, TPSA, and PHI were selected as descriptors of the nonpolar, polar, and flexible components, respectively, of the molecular structures. The chosen colors were the following: PROTACs = grey, bRo5 = orange, linkers = green, E3 ligands = red, and warheads = blue. A representative structure for each class is shown for comparison.

