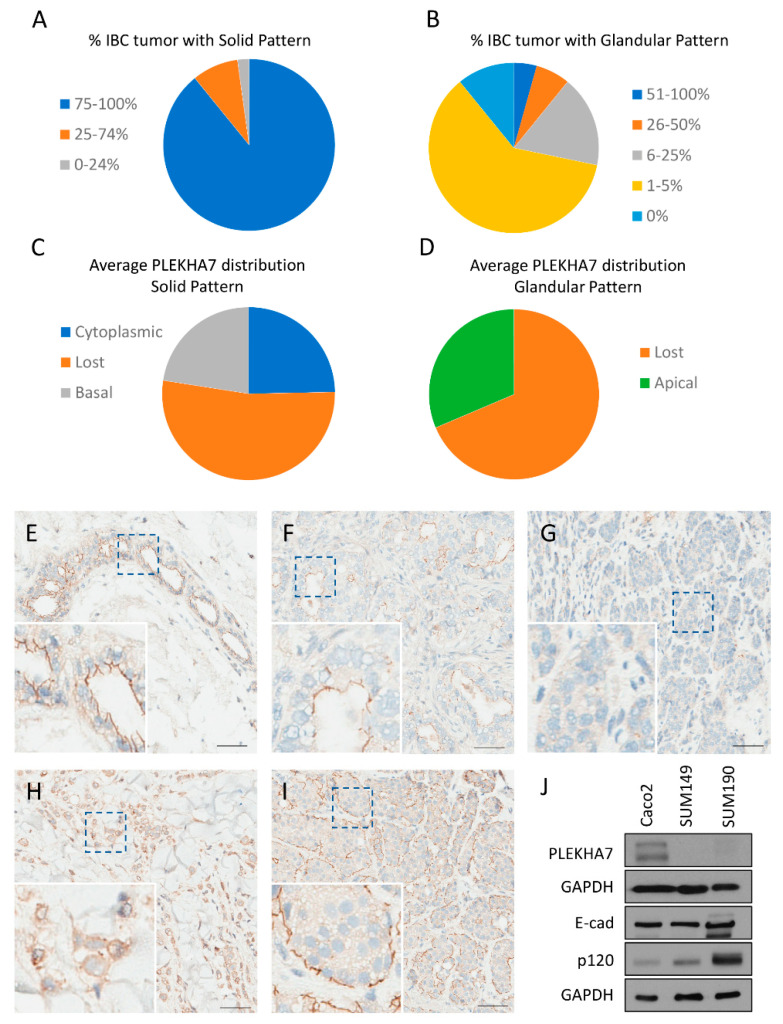
Figure 1.
PLEKHA7 expression in inflammatory breast cancer (IBC) patient samples and cell lines. (A) Pie chart displaying the number of IBC patient samples demonstrating solid tumor patterns in 0–24% (N = 1 tumor), 25–74% (N = 4 tumors), or 75–100% (N = 41 tumors) of the total tumor. (B) Pie chart displaying the number of IBC patient samples demonstrating glandular tumor patterns in 0% (N = 5 tumors), 1–5% (N = 28 tumors), 6–25% (N = 8 tumors), 26–50% (N = 3 tumors), or 51–100% (N = 2 tumors) of the total tumor. (C) Pie chart depicting the average percentage of PLEKHA7 expression as lost (56.4%), cytoplasmic (26.4%), or basal (24.1%) in the regions of solid tumor from all IBC patient samples. No apical staining of PLEKHA7 was observed in areas of solid tumor. Note that total percentage is 106.9% since some tumor cells demonstrated both a cytoplasmic and basal staining pattern. (D) Pie chart depicting the average percentage of PLEKHA7 expression as lost (68.6%) or apical (31.4%) in the regions of glandular tumor from all IBC patient samples. No cytoplasmic or basal staining of PLEKHA7 was observed in areas of glandular tumor. (E) Expression of PLEKHA7 by immunohistochemistry (IHC) in normal breast tissue. Scale bar = 100 µm in all images. (F–I) Examples of expression patterns for PLEKHA7 in IBC patient samples. (F) Apical staining, (G) loss of staining, (H) cytoplasmic staining, and (I) basal staining. (J) A representative gel image demonstrating expression of PLEKHA7, E-cadherin, and p120-catenin by Western blot is shown.

