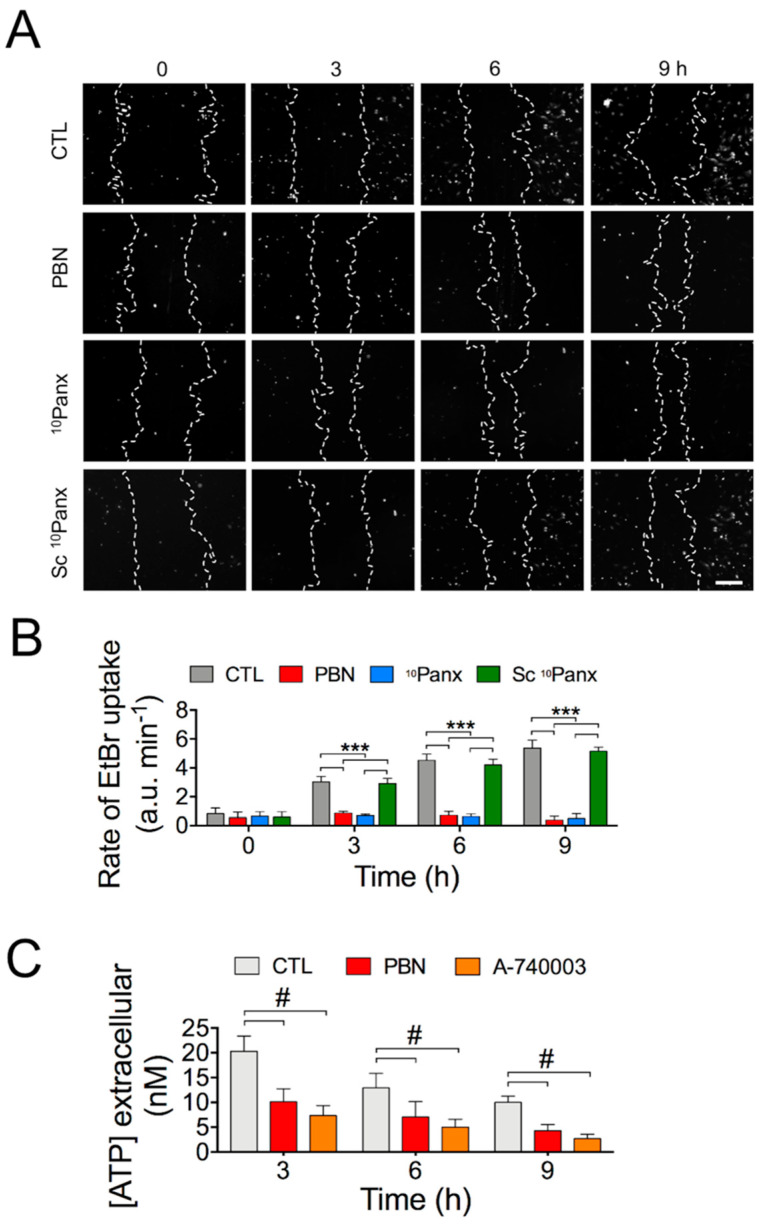
Figure 3.
Activity of Panx1 channels during wound closure in HDFs. (A) Representative fluorescent images of Ethidium (Etd) uptake by HDF cells treated with 200 µM PBN, 100 µM 10Panx, 100 µM Sc 10Panx, or vehicle (Control, CTL). Bar: 200 µm. Supplementary Figure S3A shows these same fluorescent images superimposed with their respective bright-field image. (B) Etd uptake rate measure as described in Section 4; *** p < 0.001; n = 10 (two-way ANOVA followed by Bonferroni’s post hoc test). (C) Measurements of extracellular ATP released from HDFs as a function of time in the presence or absence of 200 µM PBN or 10 µM A-740003. #: *** p < 0.001; n = 10 (two-way ANOVA followed by Tukey’s post hoc test). All data are shown as mean ± SEM.

