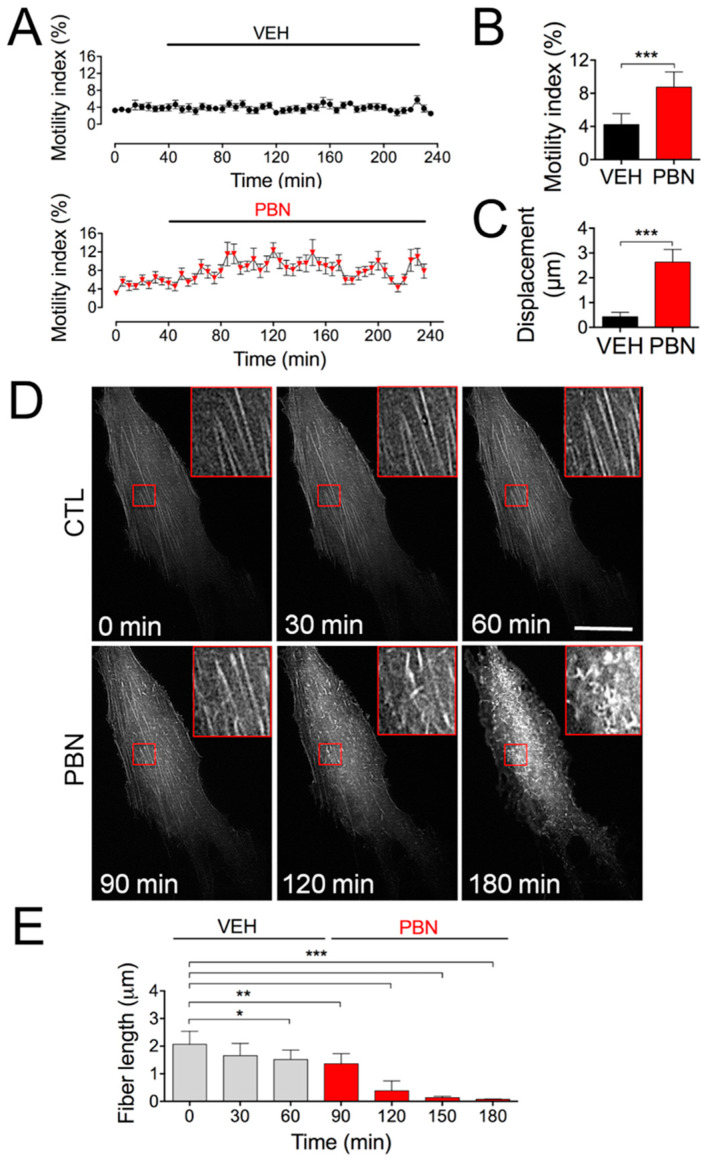
Figure 5.
The blockade of Panx1 channels increases single-cell motility and the cell surface actin dynamics. (A) Quantification of motility index during treatment with vehicle (Control, VEH) or probenecid (PBN) in 20 individual HDFs per condition. (B) Quantification of the total average motility index from 20 independent cells analyzed for each condition. *** p = 0.006; (unpaired two-tailed Student’s t-tests); n = 10 cells from 4 different cultures. (C) Quantification of total single-cell displacements after 2 h of treatment with VEH or PBN. *** p < 0.001; n = 10 cells from 4 different cultures (unpaired two-tailed Student’s t-tests). (D) Representative in vivo imaging taken with TIRF microscopy of actin cytoskeleton dynamics in HDFs. The stress fibers were identified as Life-Act-RFP-labeled filaments; 200 µM PBN was added to the culture at 70 min; hence, the image taken at 120 min corresponds to 50 min treatment with PBN. The images on the right side are magnified images of the lower’s magnification, corresponding to red boxed areas. Bar: 25 µm. (E) Quantitative analysis of stress fibers’ length before and after incubation with PBN. * p = 0.02; ** p < 0.01; *** p < 0.001; n = 10 experiments (30 cells analyzed for each repeat) (one-way ANOVA followed by Bonferroni’s post hoc test). All data are shown as mean ± SEM.

