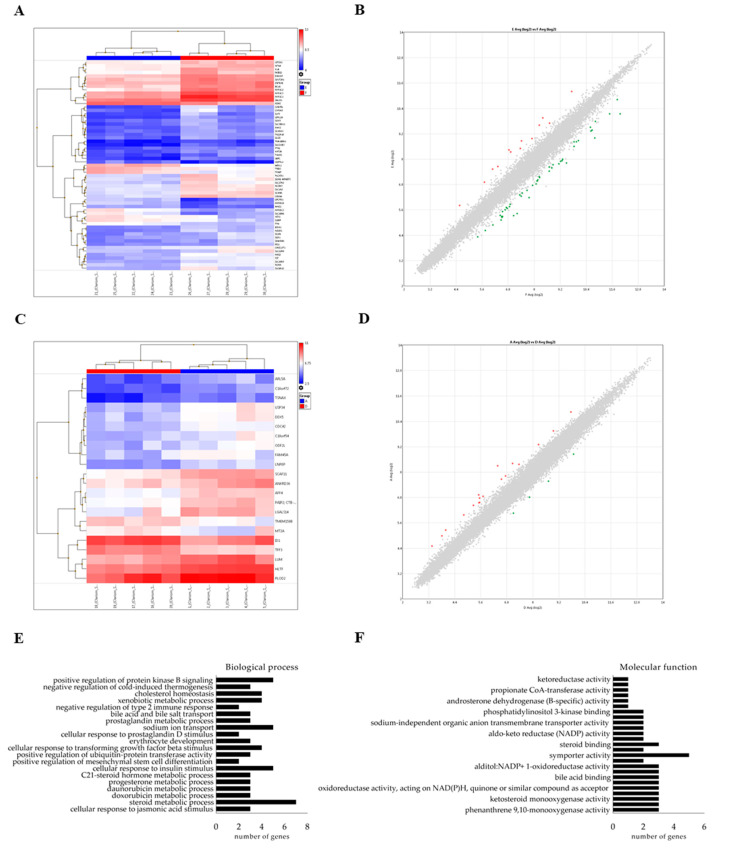
Figure 5.
(A) Hierarchical clustering of HepG2 gene profiles after exposure to hsa-miR-148a-3p (TE) or mimic negative control miRNA (TNC), during 24 h. (B) Scatter plot of differentially expressed genes in HepG2 cells. (C) Hierarchical clustering of Caco-2 gene profiles after exposure to hsa-miR-148a-3p or mimic negative control miRNA, during 24 h. (D) Scatter plot of differentially expressed genes in Caco-2 cells. (E) In-silico analysis of the possible biological processes occurring after the exposure to hsa-miR-148a-3p. (F) In-silico analysis of the possible molecular functions involved in the response to hsa-miR-148a-3p exposure.

