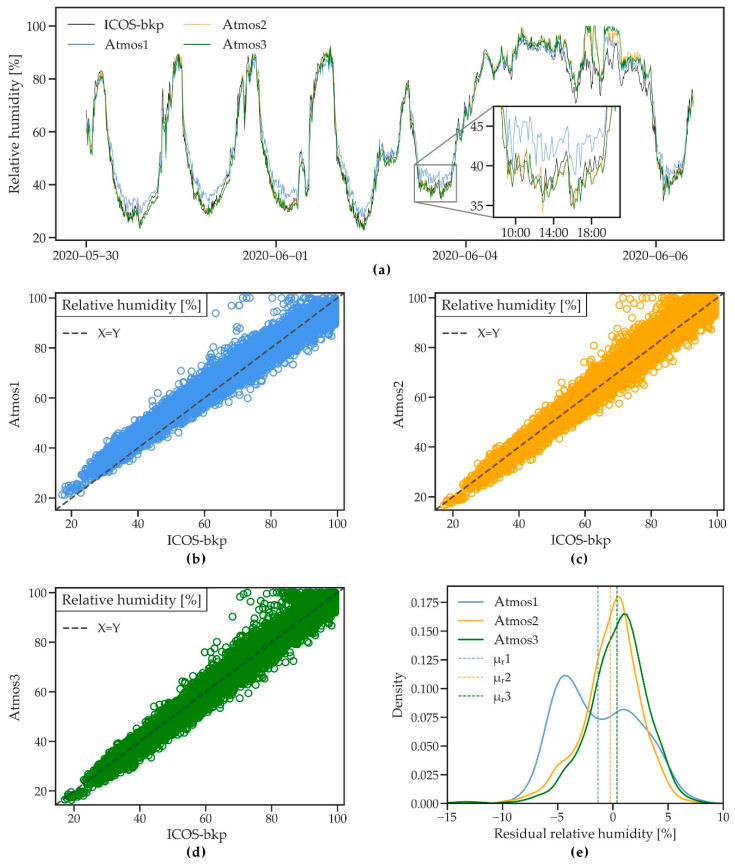
Figure 8.
(a) A short time series of relative humidity measured by three ATMOS41 weather stations and the ICOS-bkp station from 30 May to 6 June 2020. (b–d) Scatterplots of 10 min relative humidity for the three ATMOS41 stations vs. the reference station. (e) Probability density functions of the residual mean hourly relative humidity. Dashed lines show the mean of residuals (μr).

