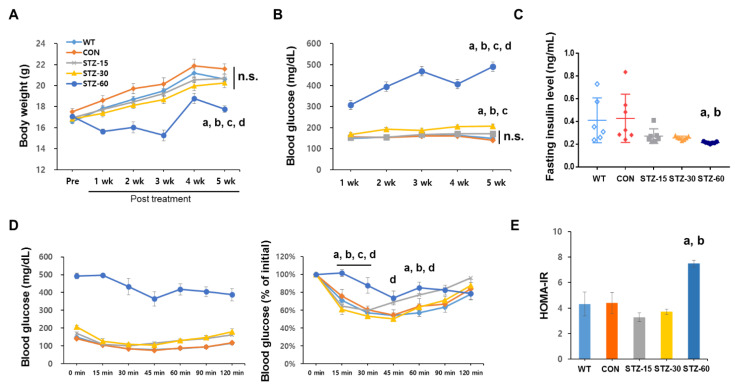
Figure 1.
Analyses of bodyweight and glucose level in streptozotocin (STZ)-treated mice. (A) Bodyweight of mice in each group during the experimental period: wild-type (WT, diamonds with black dotted line); control (CON, diamonds with a black line); 15 mg/kg streptozotocin (STZ-15, rectangles with bright orange line); 30 mg/kg streptozotocin (STZ-30, triangles with dark orange line); and 60 mg/kg streptozotocin (STZ-60, circles with red line) groups. (B) Blood glucose levels in each group. The injection of 60 mg/kg STZ induced a typical diabetes condition whereas lower doses of STZ injections did not. (C) Plasma insulin levels: WT, white diamonds; CON, black diamonds; STZ-15, bright orange rectangles; STZ-30, dark orange triangles; and STZ-60, red circles. Treatment with STZ injections did not significantly suppress insulin levels in STZ-15 and STZ-30 groups. (D) Insulin tolerance tests (ITT) were performed at 5 weeks after STZ treatment (left) and expressed as a ratio compared to initial values (right). Mice in the STZ-60 showed signs of insulin resistance. (E) Calculated homeostasis model assessment of insulin resistance (HOMA-IR) index: WT, white bar; CON, black bar; STZ-15, orange bar; STZ-30, dashed orange bar; and STZ-60, red bar. Insulin resistance was not observed in STZ-15 and STZ-30 groups. (a) significant differences compared with the WT group; (b) significant differences compared with the CON group; (c) significant differences compared with the STZ-15 group; (d) significant differences compared with the STZ-30 group; n.s., not significant.

