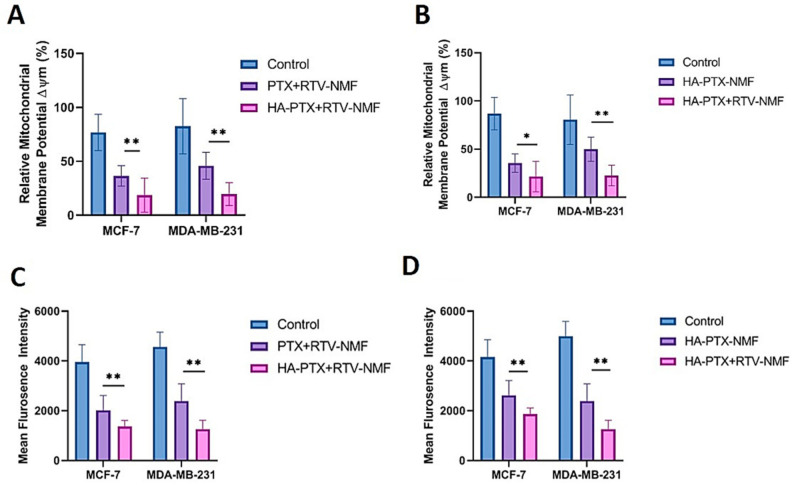
Figure 13.
In vivo potency determination of HA − PTX + RTV − NMF. (A) Difference in mitochondrial membrane potential ΔΨm (JC-1 Red/Green ratio) in MCF-7 and MDA-MB-231 breast cancer cell lines treated with nanomicellar formulations like (i) HA − PTX + RTV − NMF and (ii) PTX + RTV − NMF treated for 24 h. (B) Difference in mitochondrial membrane potential ΔΨm (JC-1 Red/Green ratio) in MCF-7 and MDA-MB-231 breast cancer cell lines treated with nanomicellar formulations (i) HA − PTX + RTV − NMF and (ii) HA − PTX − NMF treated for 24 h. (C) Determination of reactive oxygen species (ROS) in MCF-7 and MDA-MB-231 breast cancer cell lines treated with (i) HA − PTX + RTV − NMF and (ii) PTX + RTV − NMF for 24 h. (D) Determination of ROS in MCF-7 and MDA-MB-231 breast cancer cell lines treated with (i) HA − PTX + RTV − NMF and (ii) HA − PTX − NMF for 24 h. The data were expressed as mean ± SD (n = 3). (* p ≤ 0.05 and ** p ≤ 0.01 as compared to PTX + RTV − NMF/ HA − PTX − NMF group).

