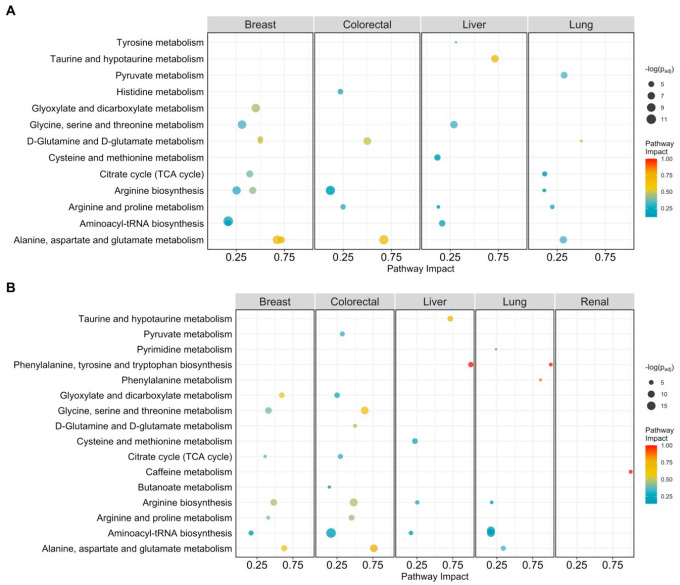
Figure 1.
Pathway analysis plot showing the impact on metabolic pathways that are significantly enriched (padj < 0.05) and have a pathway impact score > 0.1 per cancer type. Datapoints are colored according to their impact score. (A) Pathway impact according to differentially abundant metabolites (padj < 0.05); (B) pathway impact according to differentially connected metabolites (Benjamini-Hochberg adjusted p-value padj < 005).

