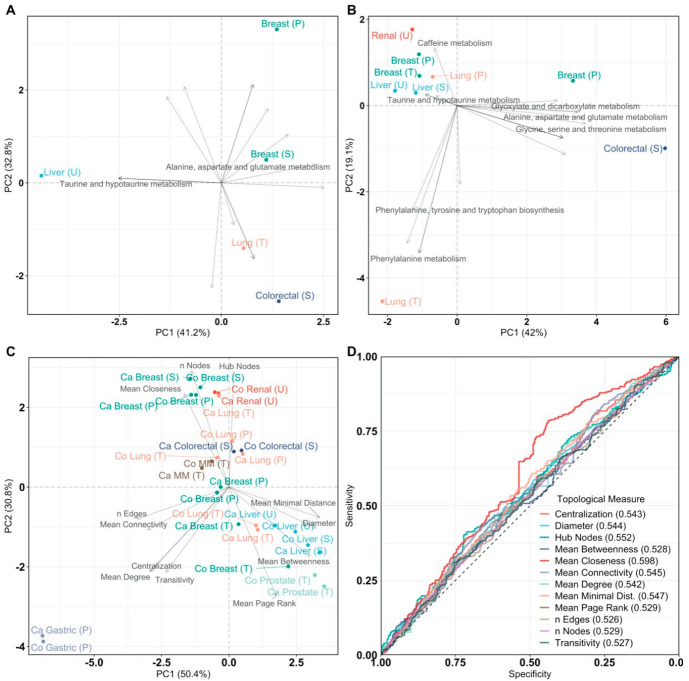
Figure 2.
Principal Component Analysis (PCA) of pathway impact and network analysis. PCA labels are colored according to their cancer type and PCA loadings are labeled if they have a pathway impact score > 0.5. Sample origin is labeled as T, U, S, P for tissue, urine, serum, and plasma, respectively. Multiple myeloma is abbreviated as MM. (A) PCA biplot of pathway impact based on differentially abundant metabolites per cancer type; (B) PCA biplot of pathway impact based on differentially connected metabolites per cancer type; (C) PCA biplot of topological network measures per cancer type for all inferred metabolite association networks. Here, networks inferred from cancer or control samples are labeled as “Ca” and “Co”, respectively; (D) receiver operating characteristic curves of topological measures predicting cancer pathology on metabolite association networks (n = 28, 14/14). Predictions are based on logistic regression, cross-validated with leave-one-out cross-validation. The Area Under the Curve (AUC), 95% confidence interval (CI), and p-value of all topological measures are Nodes: AUC = 0.529, 95% CI = 0.488–0.570, p = 0.170, Edges: AUC = 0.526, 95% CI = 0.485–0.567, p = 0.216, Mean Connectivity: AUC = 0.545, 95% CI = 0.504–0.586, p = 0.0302, Mean Degree: AUC = 0.542, 95% CI = 0.501–0.583, p = 0.0470, Mean Closeness: AUC = 0.598, 95% CI = 0.557–0.638, p = 2.20 × 10⁻⁶, Mean Betweenness: AUC = 0.528, 95% CI = 0.487–0.570, p = 0.175, Diameter: AUC = 0.544, 95% CI = 0.503–0.585, p = 0.0369, Mean Minimal Distance: AUC = 0.547, 95% CI = 0.506–0.588, p = 0.0244, Mean Page Rank: AUC = 0.529, 95% CI = 0.488–0.570, p = 0.165, Hub Nodes: AUC = 0.552, 95% CI = 0.511–0.593, p = 0.0137, Centralization: AUC = 0.543, 95% CI = 0.502–0.584, p = 0.0422, and Transitivity: AUC = 0.527, 95% CI = 0.486–0.568, p = 0.196. Definitions of topological measures are given in Methods.

