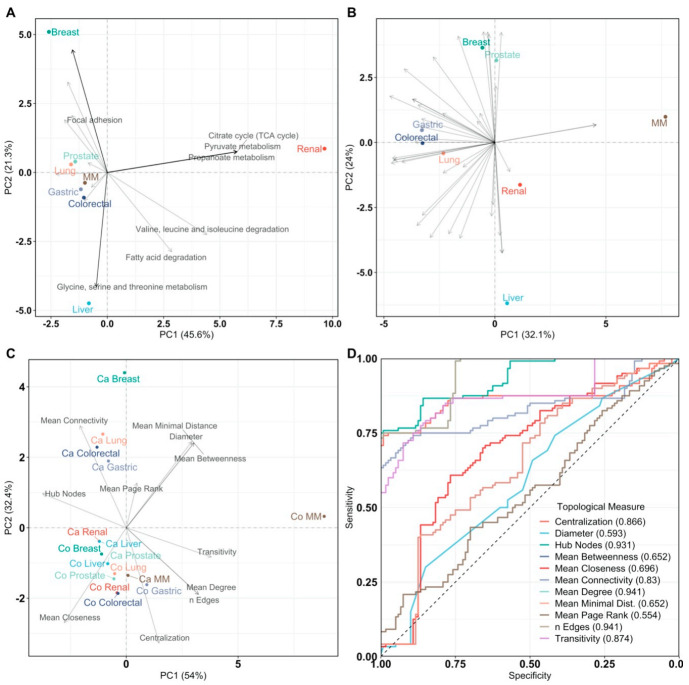
Figure 4.
Principal Component Analysis of pathway impact and network analysis. PCA labels are colored according to their cancer type and PCA loadings are labeled if they have a pathway impact score > 0.5. Multiple myeloma is abbreviated as MM. (A) PCA biplot of pathway impact based on differentially abundant genes per cancer type; (B) PCA biplot of pathway impact based on differentially connected genes per cancer type; (C) PCA biplot of topological network measures per cancer type for all inferred gene networks. Here, networks inferred from cancer or control samples are labeled as “Ca” and “Co”, respectively; (D) receiver operating characteristic curves of topological measures predicting cancer pathology on gene association networks (n = 16, 8/8). Predictions are based on logistic regression, cross-validated with leave-one-out cross-validation. The Area Under the Curve (AUC), 95% confidence interval (CI), and p-value of all topological measures are Edges: AUC = 0.941, 95% CI = 0.915–0.967, p = 7.59 × 10−242, Mean Connectivity: AUC = 0.830, 95% CI = 0.774–0.886, p = 8.80 × 10⁻³¹, Mean Degree: AUC =0.941, 95% CI = 0.915–0.967, p = 7.59 × 10−242, Mean Closeness: AUC = 0.696, 95% CI = 0.628–0.764, p = 1.85 × 10⁻⁸, Mean Betweenness: AUC = 0.652, 95% CI = 0.582–0.722, p = 2.14 × 10⁻⁵, Diameter: AUC = 0.593, 95% CI = 0.521–0.665, p = 0.0114, Mean Minimal Distance: AUC = 0.652, 95% CI = 0.582–0.722, p = 2.14 × 10⁻⁵, Mean Page Rank: AUC = 0.554, 95% CI = 0.481–0.627, p = 0.146, Hub Nodes: AUC = 0.931, 95% CI = 0.902–0.961, p = 2.93 × 10−178, Centralization: AUC = 0.866, 95% CI = 0.813–0.919, p = 8.00 × 10−42, and Transitivity: AUC = 0.874, 95% CI = 0.828–0.92, p = 1.48 × 10−56. Definitions of topological measures are given in Methods.

