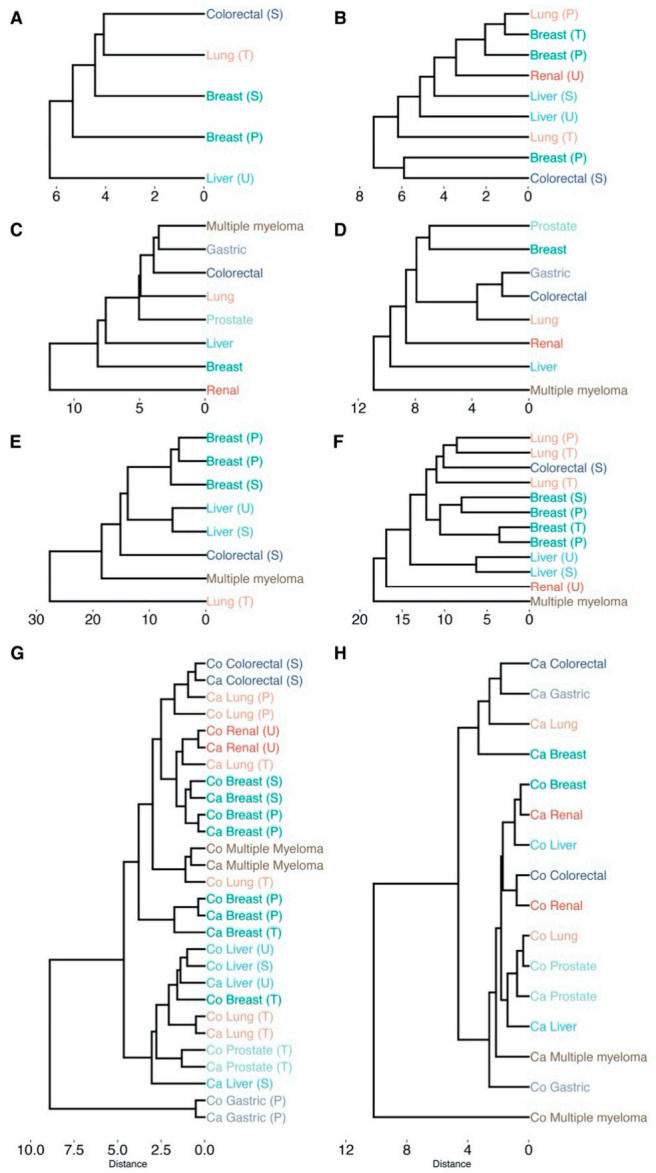
Figure 6.

Hierarchical clustering of cancer types based on the impact on cellular pathways that are significantly enriched (padj < 0.05). Labels are colored according to their cancer type. Sample origin is denoted as T, U, S, P for tissue, urine, serum and plasma, respectively (all transcriptomics analyses originate from tissue). All clustering is based on Euclidean distance and average linkage: (A) differentially abundant metabolites (padj < 0.05); (B) differentially connected metabolites (padj < 0.05); (C) differentially expressed genes (padj < 0.05); (D) differentially connected genes (padj < 0.05); (E) differentially abundant metabolites (padj < 0.05) and differentially expressed genes (padj < 0.05) conjoined; (F) differentially connected metabolites (padj < 0.05) and differentially connected genes (padj < 0.05) conjoined; (G) dendrogram based on the topological network measures per cancer type for all inferred metabolite association networks. Here, networks inferred from cancer or control samples are labeled as “Ca” and “Co”, respectively. (H) Dendrogram based on the topological network measures per cancer type for all inferred genes association networks. padj indicates Benjamini–Hochberg corrected p-values.
